
Figures & data
Figure 1. STEM persistence framework adapted from Graham et al. (Citation2013) to include a career course.
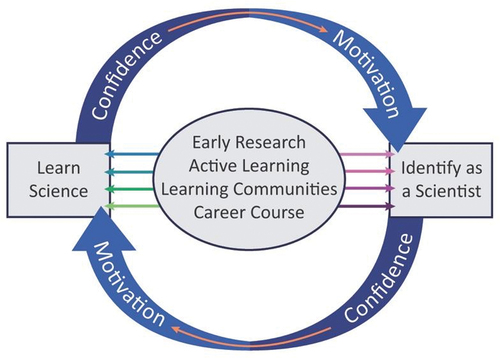
Table 1. Demographic characteristics for LS110 career course with distributions shown as percentages of total enrolment in 2016–19 (N = 894).
Table 2. Change in satisfaction with career choice and change in confidence with staying in major, obtaining an internship/job, research experience, or applying/going to graduate/professional school (N = 427).
Figure 2. Impact of the career course on confidence about and completion of degree in the major (N = 427).
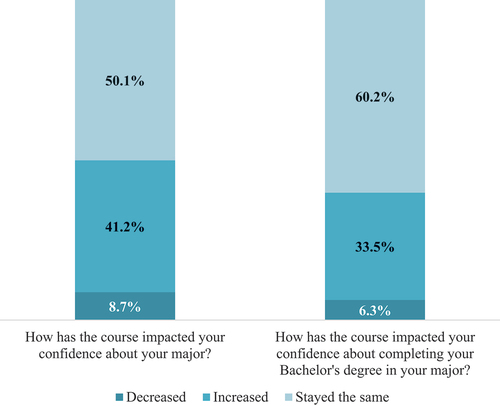
Table 3. Percentage of survey respondents who completed career-related skills before taking the course, after completing the course, and the percent change for each skill (N = 424).
Supplemental material