
Figures & data
Table 1. Implementation of phase 1 and phase 2 of the innovation project activities, respective durations (hours), calendar timepoints and descriptions.
Table 2. Distribution of participants in phase 1 of the innovation project in 2016, 2017 and 2018 showing project year, number of project groups and participating students, associated ratio of males (M) and females (F), and number of questionnaires (and response rate).
Figure 1. Authenticity rating (%) per authentic learning element in the 2016, 2017 and 2018 student cohorts.
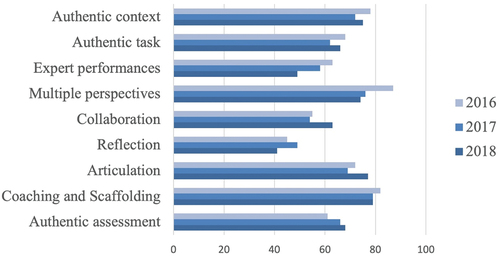
Figure 2. Box plots showing the distribution of perceived authenticity rating (%) for each cohort in year 2016, 2017 and 2018 (one outlier in the 2017 cohort).
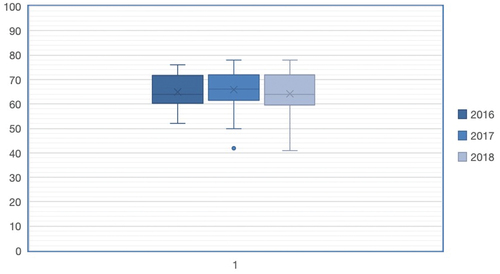
Table 3. Results of the deductive phase of the interview data analysis showing representative student perceptions of authenticity in the learning environment of the innovation project.
Table 4. Results of the inductive phase of the interview data analysis showing five new emergent themes of students’ perceptions of their experiences of the innovation project.