Figures & data
Table 1. The object-representamen relationship. Adapted from Legg (Citation2017) and Jappy (Citation2013).
Figure 1. Final drawing consisting of five clusters of representations.
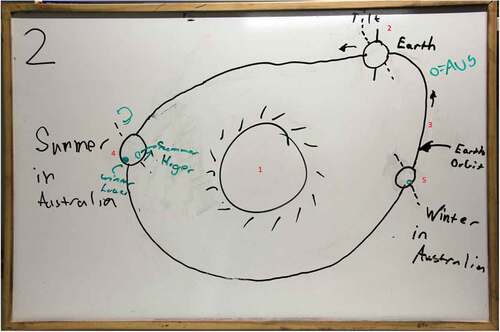
Table 2. Iconic relationships between and within the five clusters of representations.
Figure 2. S1 spins the globe in an anticlockwise direction (as indicated by our dashed arrow).
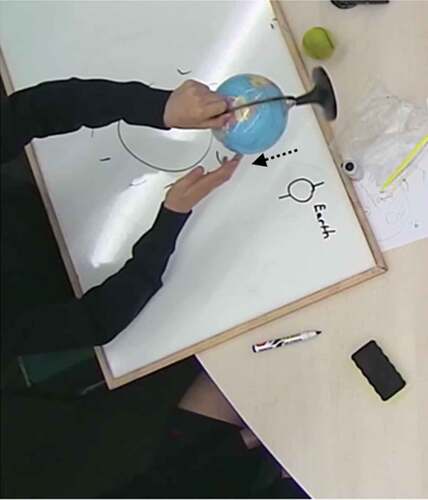
Figure 3. S1 holds the globe, looks at it and places it down and then draws the tilt (rotational axis of the Earth) and labels it.
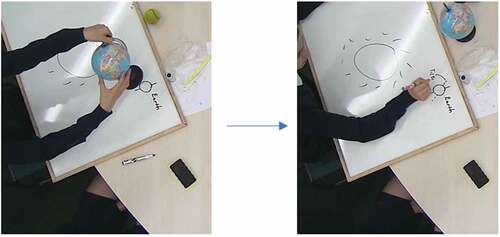
Figure 4. S1 draws arrows to indicate the anticlockwise direction of the Earth’s elliptical orbit of the Sun.
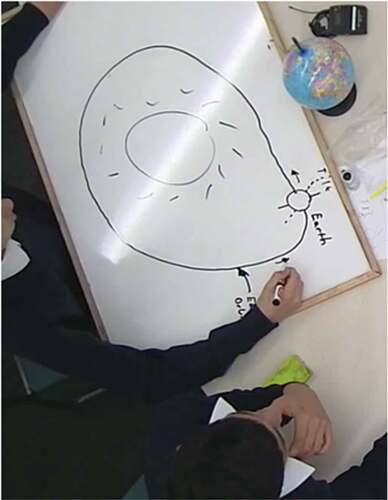
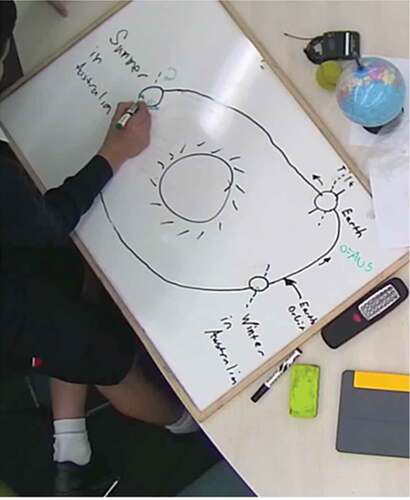
Figure 5. S1 draws the astronomical position of Earth in Summer in Australia (exclaiming ‘And here, it’s Summer in Australia’) and the astronomical position of Earth in Winter in Australia (labelling ‘Winter in Australia’).

Figure 6. S2 draws circles on the ‘Summer in Australia’ and ‘Winter in Australia’ Earths to mark Australia’s location relative to the Sun’s incoming energy.
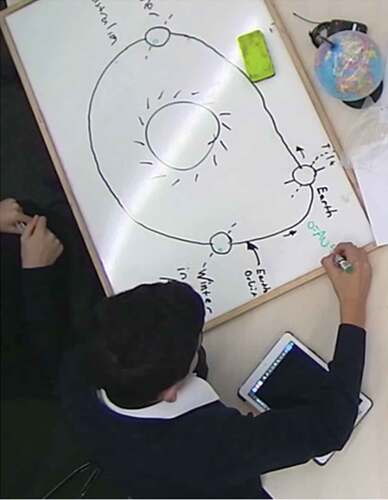
Figure 7. S1 using the globe and torch to gesture the exposure of Australia to the Sun’s light rays in Summer. We call this material-embodied diagramming process ‘light rays’.
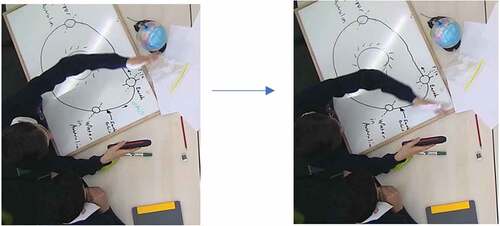
Figure 8. S2 using the globe and torch to show the ‘higher’ angle of the Sun’s light rays hitting Australia in Summer.
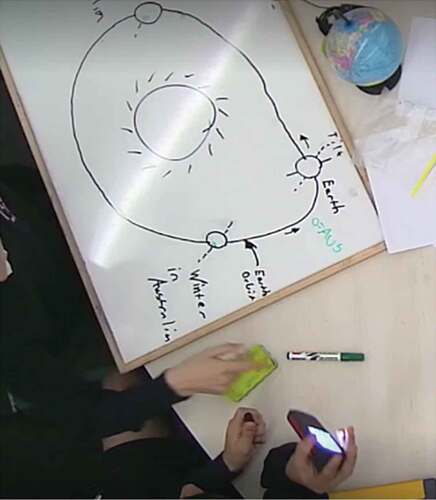
Figure 9. S1 tilting the globe from its orbital axis to emphasise the angle at which the Sun’s light rays hit Australia in Winter.
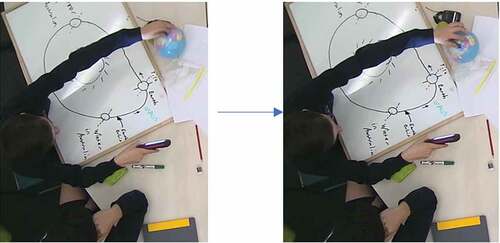
Figure 10. S1 rotating the whole globe not on its axis but from its base (as indicated by our dashed arrow) while shining the torch at Australia.
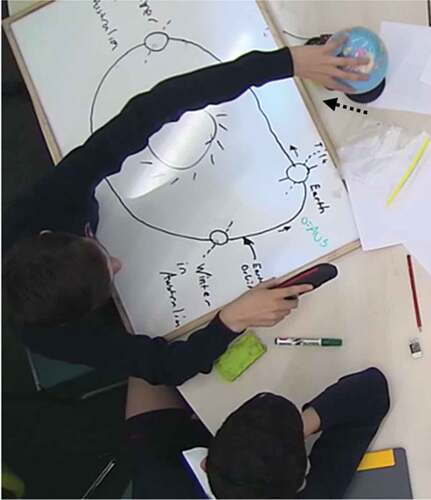
Figure 11. S2 gesturing and drawing the rotation of the Earth on its axis (as indicated by our dashed arrow).
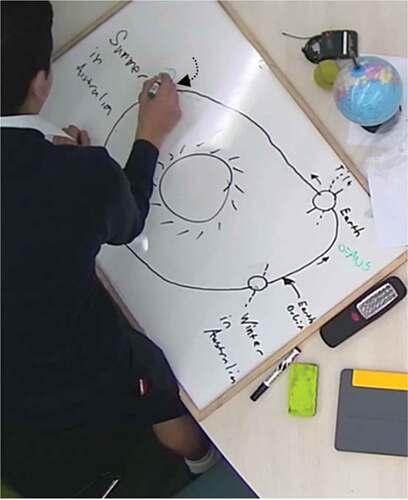
Figure 12. S2 gesturing and drawing the ‘upward’ angle of Australia on Earth relative to the Sun in Summer (as indicated by our dashed arrow).
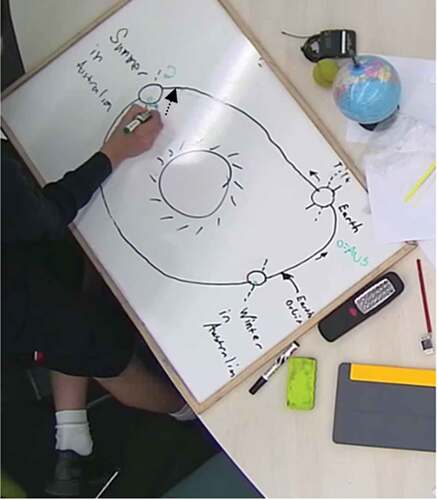
Figure 13. S2 drawing the position of Australia (green circle) during the Winter.