
Figures & data
Figure 1. Chilean education structure and levels.
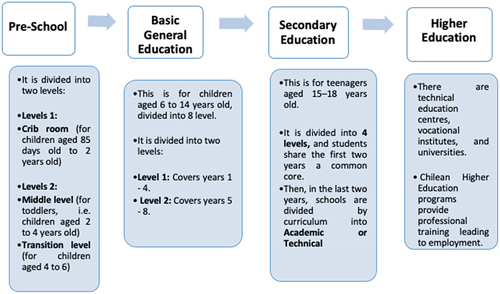
Figure 2. Description of students based on age, gender, SES, and type of school in central southern region of Chile.
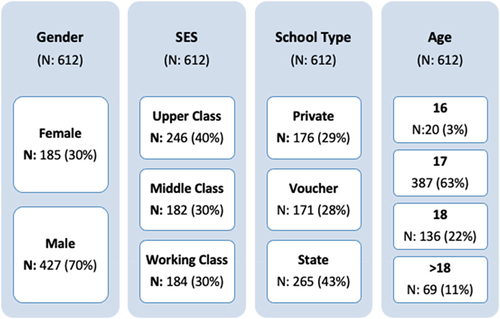
Figure 3. Five cut-off scores based on Uno and Bybee’s taxonomy (1994).
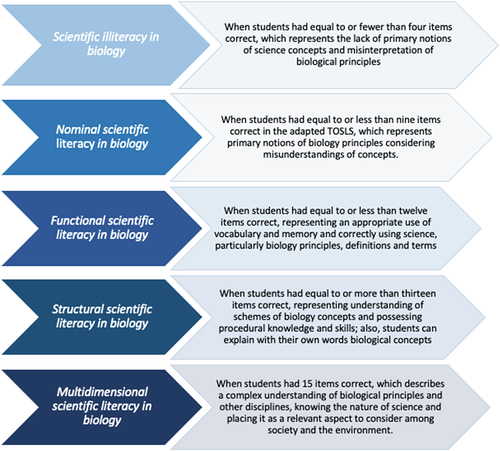
Figure 4. Overview of the adapted TOSLS, considering the description of those items used in the Chilean test version.
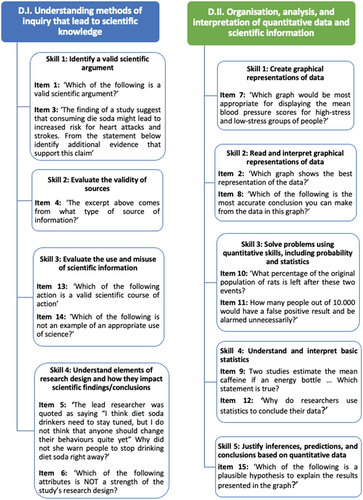
Figure 5. Outcomes from Chilean students who took the adapted TOSLS version (N = 612).
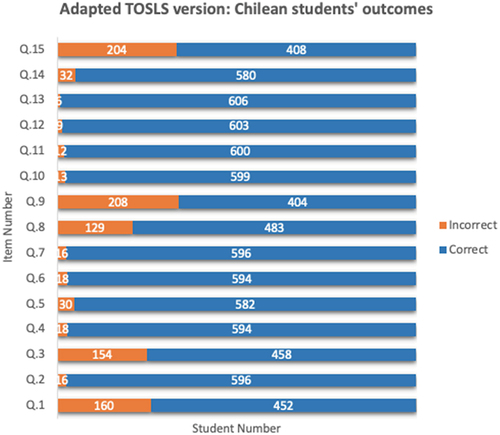
Table 1. Adapted TOSLS: Median frequency table by SES, type of school and age.
Figure 6. Summary of student results according to the adapted version of TOSLS, considering school type, SES, and gender.
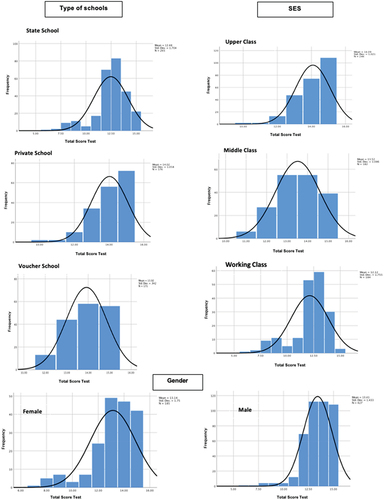
Figure 7. Adapted LSSr description and an example of items within dimension used in the Chilean educational context.
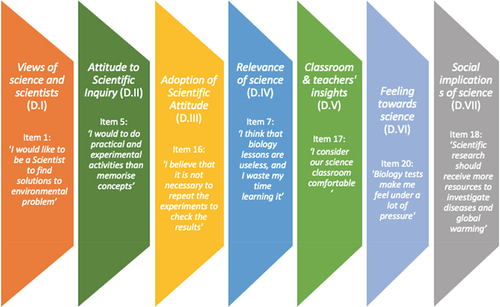
Table 2. Likert scale test, Chilean version: Median frequency table by SES, type of school and age.
Supplemental Material
Download MS Word (571 KB)Data availability statement
The data cannot be publicly shared because of privacy regulations on pupils’ data. Participants were informed that only researchers have access to the data which will be treated as strictly confidential.