Figures & data
Figure 1. Static trial showing the location of the 78 passive reflective markers. The marker locations were: left and right fore- and rear-head, acromion bilaterally, clavicle, sternum, C7, L1, medial and lateral elbow, medial and lateral wrist, 2nd and 5th metacarpal heads of both hands, anterior superior iliac spine, iliac crest, posterior superior iliac spine, medial and lateral knee, medial and lateral ankle, calcaneus, lateral midfoot, 1st and 5th metatarsal heads, head of the first toe. Eight technical clusters were strapped to the mid-humeri, mid-radius, mid femur and mid-shank (shown in black).
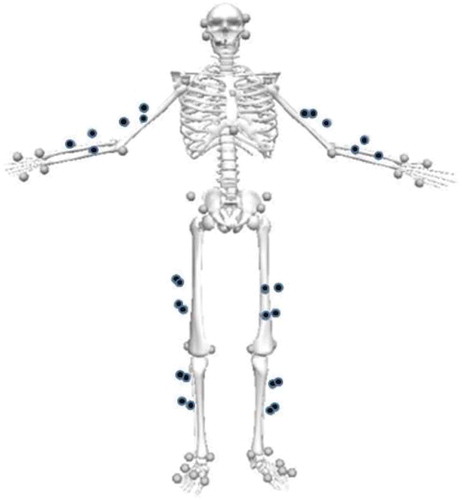
Table 1. Comparison of kinematic data: normalised step width, step length, block time, 1st stance contact time, and anteroposterior centre of mass (CoM) velocity at toe-on and toe-off for both skating and narrow trials.
Figure 2. Relationship between anterior CoM velocity at 1st stance toe-off versus normalised step width. No correlation between these parameters was observed for either step width.
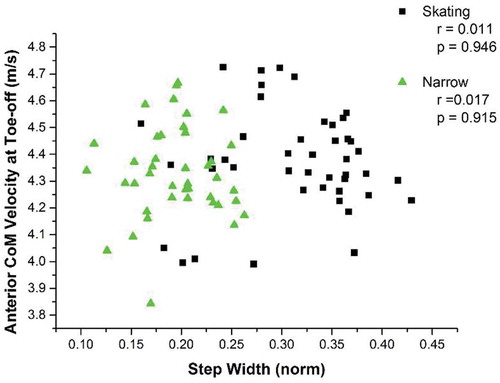
Figure 3. Example of the mean transverse plane motion of the CoM from Start to 1st step toe-off for a typical participant. Skating trials are depicted with the solid line and the narrow trials with the dashed line.
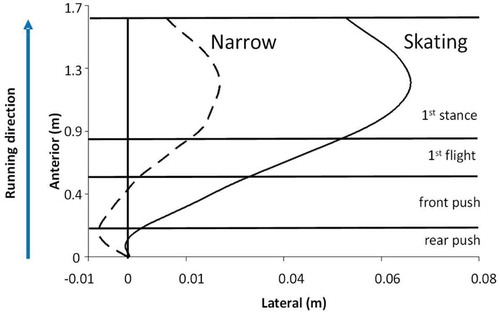
Figure 4. Example of mediolateral front (a) and rear leg (b) block forces and mediolateral (c) and anteroposterior (d) 1st stance forces for a typical participant. The forces are normalised to body weight. The vertical line in graph (a) denotes the end of the rear block time. More medial reaction force can be seen for the skating trials.
Table 2. Mean ground reaction force angles during the starting block and 1st step phases.
Table 3. Starting block and 1st step: relative impulses, normalised external power and ground reaction force vector magnitudes.
Figure 5. Visual representation of the ensemble average normalised GRF for the block phase (top row) and 1st stance phase (bottom row). *Significant difference between Skating and Narrow trials (p < 0.05).
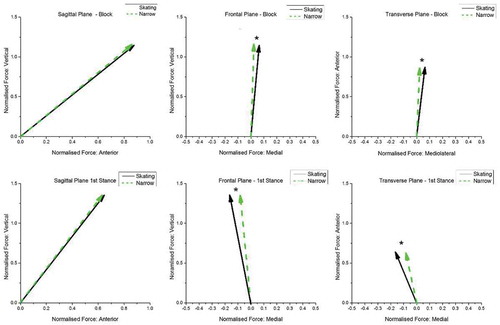
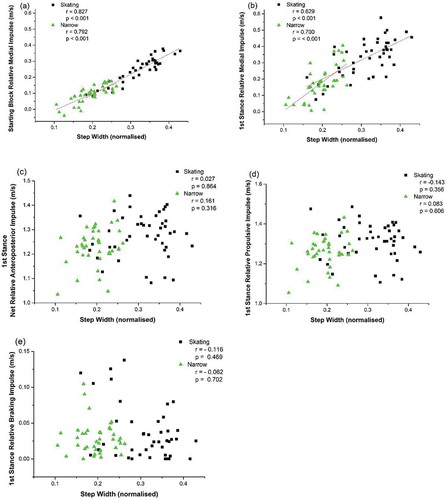
Figure 6. Relationships between starting block net relative medial impulse (a), 1st stance net relative medial impulse (b), 1st stance net relative anteroposterior impulse (c), 1st stance relative propulsive impulse (d), 1st stance relative braking impulse (e) and normalised 1st step width. A high (Figure 6a) and moderate (Figure 6b) correlation was found between these variables.