
Figures & data
Figure 1. The relation between volume of MVPA and mathematics post-test scores for the two intervention groups.
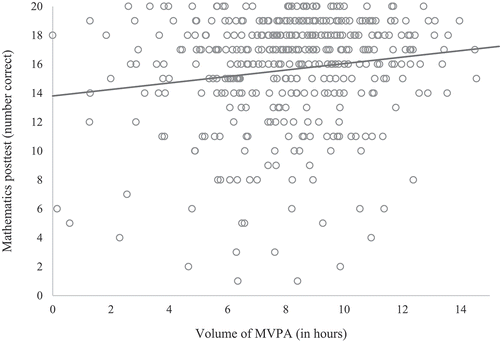
Table 1. Baseline characteristics of children, for the total sample and separately for the control group, aerobic intervention group and cognitively engaging intervention group.
Table 2. Average pre-test and post-test scores (n correct) and standard deviations in reading, mathematics and spelling for the three conditions.
Figure 2. The relation between volume of MVPA and spelling post-test scores for the two intervention groups.
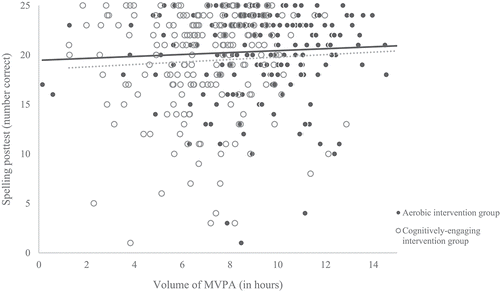
Figure 3. Relation between reading pre-test and reading post-test for the control group and the cognitively engaging intervention group.
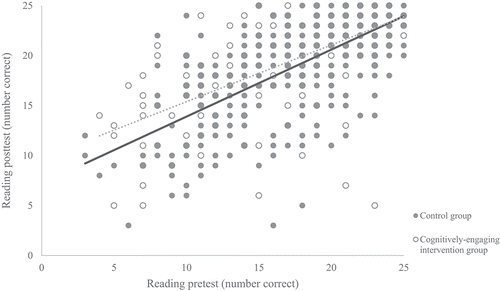
Figure A1. Flow chart with the number of participating classes and children in each stage of the study.
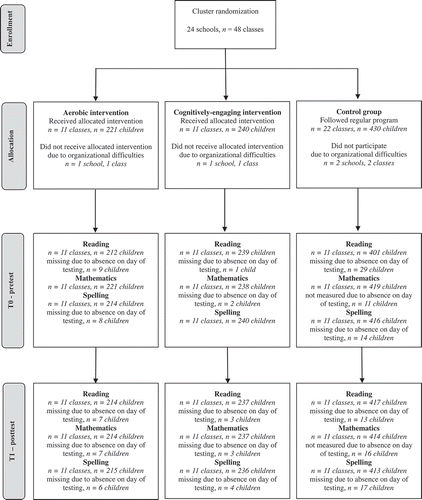
Table 1. Session plan for the aerobic intervention program.
Table 2. Session plan for the cognitively engaging intervention program.
Table 100. Average amount of MVPA in the three groups.