
Figures & data
Figure 1. The pelvic and thigh coordinate systems. The pelvic coordinate system was used for calculating the pelvis segment angles relative to the laboratory coordinate system. The thigh coordinate system was used to calculate the orientation of the rear thigh with respect to the pelvis.
Figure 2. Pelvic segment angles from start to 1st stance toe-off (normalised to 100 points) in the sagittal (a), frontal (b) and transverse (c) and planes for all participants. The black line represents the group mean. The vertical lines represent (from left to right) the key events of rear foot-off, block exit and toe-on. The position of the vertical lines is approximately drawn for the group of athletes; 1st, 2nd, 3rd, 4th and 5th refer to the top five athletes ranked according to their PNAHB (). Ensemble group average rear leg hip angles with respect to the pelvis segment, Figure 2 (d). Positive hip angles represent hip flexion, abduction and internal rotation.
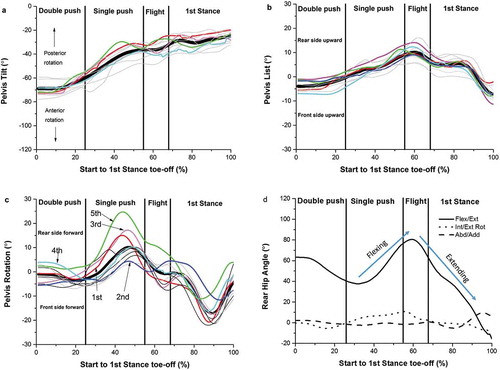
Figure 4. Relationships between pelvic list (a), rotation (b) and tilt (c) RoM and normalised 1st step width. A high positive correlation was found for the relationship between pelvic list RoM and 1st step width (graph a); 1st, 2nd, 3rd, 4th and 5th refer to the top five athletes ranked according to their PNAHB.
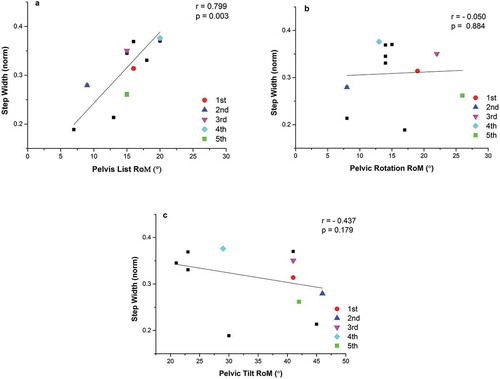
Figure 5. Relationships between pelvic list (a), rotation (b) and tilt (c) RoM and block phase performance; 1st, 2nd, 3rd, 4th and 5th refer to the top five athletes ranked according to their PNAHB.
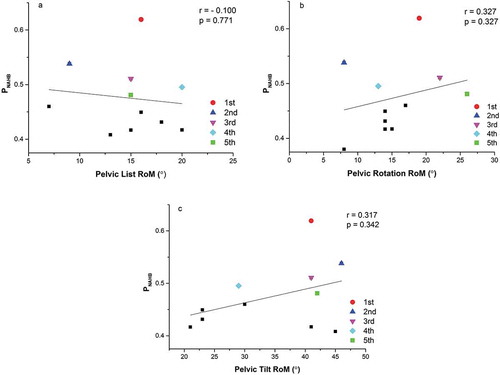
Figure 6. Relationships between normalised 1st step width and: block performance (a), and 1st stance performance (b). No linear correlations were found between these variables; 1st, 2nd, 3rd, 4th and 5th refer to the top five athletes ranked according to their PNAHB. NB as opposed to Figure 6(a), Figure 6(b) shows external power on the y-axis because during the 1st stance, step width was defined as the independent variable.
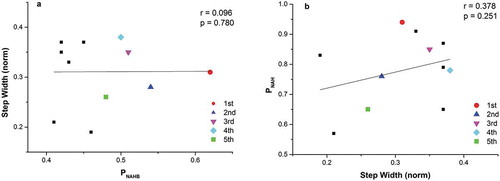
Figure 3. Typical example of an athlete in the position of maximum pelvic list. Notice how the rear side pelvis is more upwards than the front side (a), and how medial orientation of the thigh accompanies pelvic orientation (b).
Table 1. A comparison of each participant’s normalised block power (PNAHB), pelvic RoM, normalised 1st step width and normalised 1st stance power (PNAH). Their respective group ranking for PNAHB is also given.