Figures & data
Figure 1. GRF and COPA-P mean ±1 standard deviation (shaded areas) values for the preferred (solid blue line, upper panels) and non-preferred limb (solid orange line, upper panels) at each running stage (Start, Mid, End). Respective SPM{t} and ES analysis are presented below each GRF and COPA-P panels. SPM{t} = solid blue lines; t threshold = blue dashed lines; ES = solid orange lines
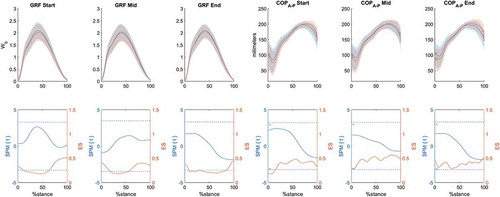
Figure 2. Joint and tendon kinematics mean ±1 standard deviation (shaded areas) values for the preferred (solid blue line) and non-preferred (solid orange line) limb at each running stage (Start, Mid, End). Respective SPM{t} and ES analysis are presented below each joint and tendon kinematics panel. SPM{t} = solid blue lines; t threshold = blue dashed lines; ES = solid orange lines
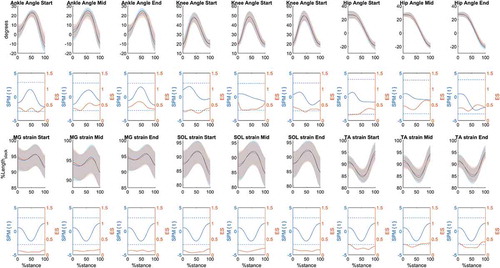
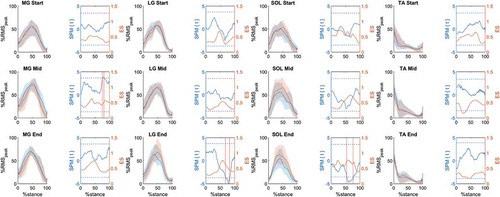
Figure 3. Medial gastrocnemius (MG), lateral gastrocnemius (LG), soleus (SOL) and tibialis anterior (TA) mean ±1 standard deviation (shaded areas) values for the preferred (solid blue line) and non-preferred limb (solid orange line) at each running stage (Start, Mid, End). Respective SPM{t} and ES analysis are presented beside each muscle activation panel. SPM{t} = solid blue lines; t threshold = blue dashed lines; ES = solid orange lines. Vertical red lines indicate the portion of stance phase in which p < 0.05