
Figures & data
Figure 1. Illustration of the performance of a) ISO 300 (isometric knee flexion at 90) and c) kneeling ISO (isometric knee flexion at 90 prone)
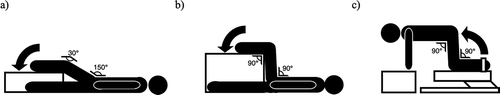
Table 1. Within- and between-session reliability of hamstring strength assessments
Figure 2. Comparison of peak force of the left and right limb during a) ISO (isometric knee flexion at 30), b) IS) 90 (isometric knee flexion at 90) and c) Kneeling ISO (isometric knee flexion at 90 prone and d) NHE (Nordic hamstring excercise) between testing sessions. Individual data is plotted opn the upper axes. Paired mean difference are plotted as a boopstrap sampling distribution. mean dissference arc depicted as dots; 95% confidence intervals are indicated by the ends of the vertical error bars
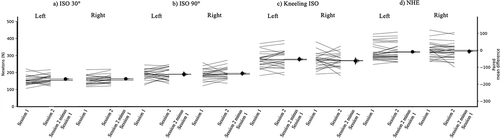
Table 2. Differences between-session comparisons within- and between-limb
Figure 3. Individual asymmetry data for peak force during a0 ISO 30 (isometric knee flexion at 30), b) ISO 90 (isometric knee flexion at 90) and c) Kneeling ISO (isometric knee flexion at 90 prone) and d) NHE (Nordic hamstring excercise). Above the x axis signifies right limb dominance, below signifies left limb dominance
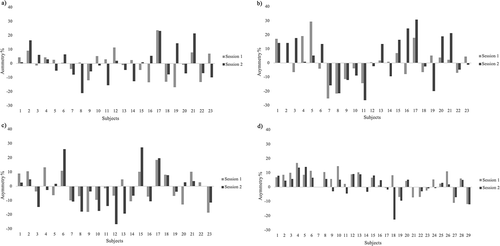
Table 3. The magnitude and direction of asymmetries within-session
Data availability statement
The data that support the findings of this study are available upon reasonable request from the corresponding author.