
Figures & data
Table 1. Details of the expert panel
Table 2. Characteristics of participating athletes
Figure 1. ICF scores across the three groups
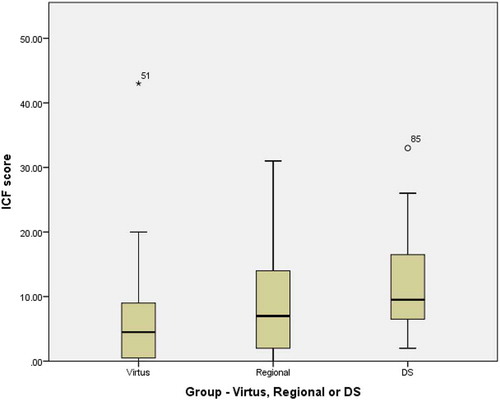
Table 3. Comparisons between the three groups of athletes on the ICF-based questionnaire total score, using an independent samples Kruskal-Wallis test, and the effect size (r) of post-hoc comparisons
Table 4. One-way ANOVA comparisons between the three groups of athletes on IQ
Table 5. Multinomial logistic regression predicting group membership, with Virtus as the reference group
Supplemental material