Figures & data
Table 1. Characteristics of Para athletes with hypertonia and non-disabled participants (mean (SD))
Figure 1. Phases of the movement task: (a) initial position; (b) end of right shoulder flexion/left shoulder extension; (c) mid-cycle position (left shoulder flexing, right shoulder extending); (d) end of left shoulder flexion/right shoulder extension
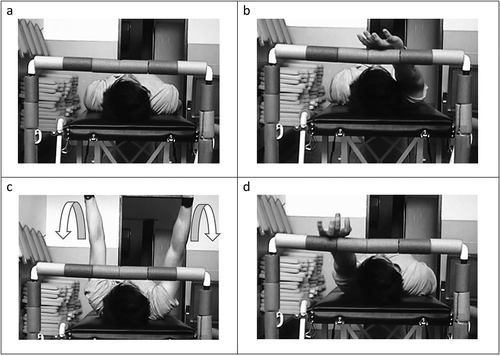
Figure 2. Wrist acceleration profiles from one shoulder flexion-extension cycle of four representative participants: Non-disabled (panels A and E), diplegic (panels B and F), hemiplegic (panels C and G), and quadriplegic (panels D and H). Left and right side panels present data for the 30 bpm and 120 bpm trials, respectively. Vertical line denotes instant of hand contact with physical target
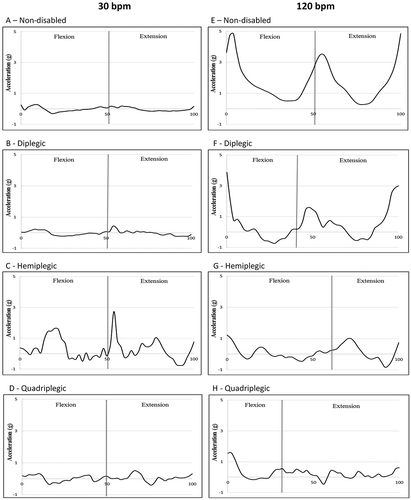
Figure 3. The number of acceleration peaks during cyclic upper limb actions performed at 30 bpm and 120 bpm in non-disabled participants and Para athletes. The grey symbols represent participants that were incorrectly classified during out-of-bag predictions during random forest modelling
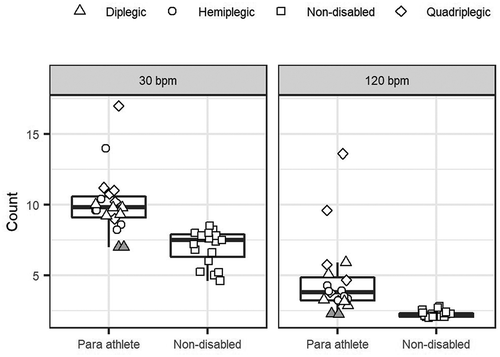
Figure 4. The rhythm error during cyclic upper limb actions performed at 30 bpm and 120 bpm tempos in non-disabled participants and Para athletes. The grey symbols represent participants that were incorrectly classified during out-of-bag predictions during random forest modelling
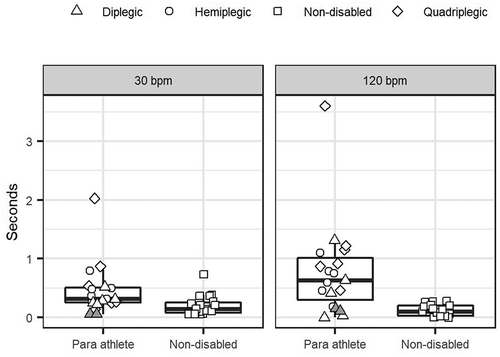
Figure 5. The accuracy error (a) and endpoint variability in target contacts (b) during cyclic upper limb actions performed at 30 bpm and 120 bpm in non-disabled participants and Para athletes. The grey symbols represent participants that were incorrectly classified during out-of-bag predictions during random forest modelling
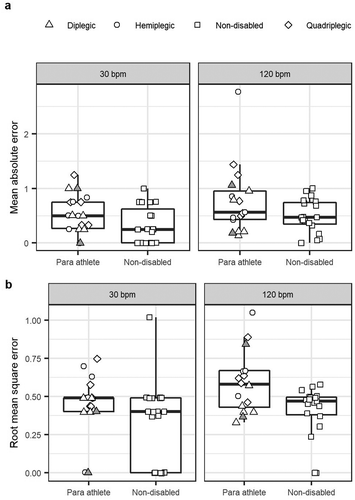
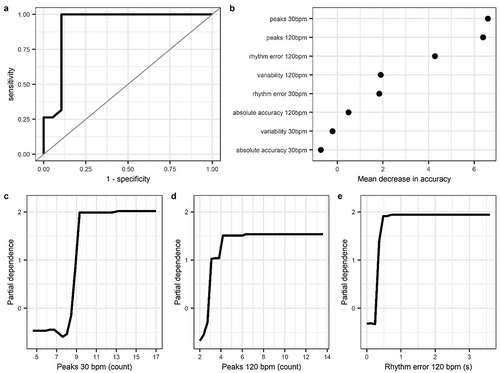
Figure 6. Accuracy and variable importance of the random forest model in classifying Para athletes and non-disabled participants. (a) The receiver operating characteristics (ROC) curve shows the accuracy of the random forest model in classifying Para athletes and non-disabled participants (AUC = 0.924). (b) Mean decrease in accuracy scores are used to indicate the importance of variables in classifying Para athletes and non-disabled participants. A higher mean decrease in accuracy score for a given variable indicates a greater reduction in classification accuracy when this variable is singularly removed from the model, and therefore a greater importance in correctly classifying cases. Partial dependence plots were used to interpret the marginal effect of the three most important variables, (c) acceleration peaks at 30 bpm, (d) acceleration peaks at 120 bpm, and (e) rhythm error at 120 bpm, in predicting whether a case is a Para athlete or non-disabled participant. Partial dependence values above 0 indicate a positive influence for classification in the model. For example, when considering the effect of acceleration peaks at 30 bpm (c) there is greater chance that participants will be classified as Para athletes if they achieve a count of 9 or more acceleration peaks