Figures & data
Figure 1. Schematic demonstration of the change of direction test.
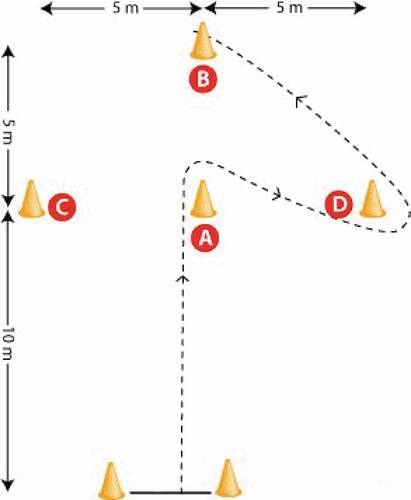
Figure 2. Schematic demonstration of the athletic skills parkour.
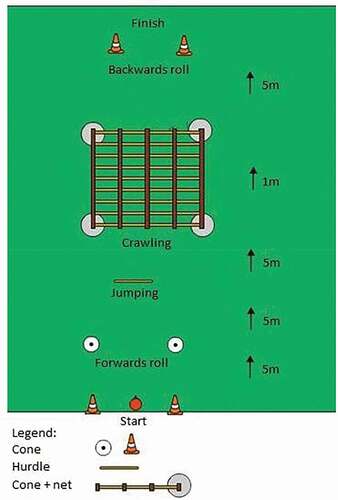
Figure 3. Schematic demonstration of the Loughborough Soccer Passing Test (LSPT; Ali et al., Citation2007).
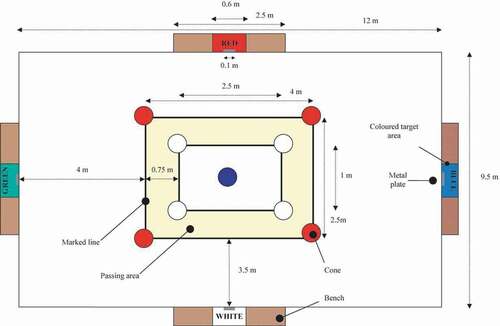
Table 1. Number of measurements per participant per age group, stratified by selection status
Figure 4. Average of each measure at each age for selected and deselected players. Blue lines represent selected players and red lines represent deselected players. Curves that don’t start at U9 are because there was no available data at U9 on this particular test. The tick marks on the X axis represent, from left to right, the U9, U10, U11 and U12 age categories.
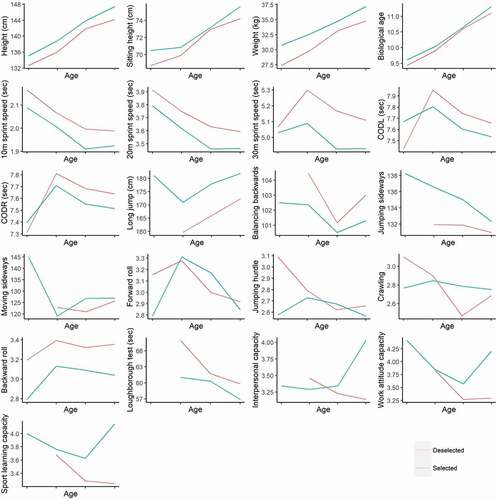
Table 2. Descriptive statistics of age, anthropometric characteristics (mean ± SD) and the number of participants. (N) at the moment of selection into U13
Table 3. Results of the GEE analyses investigating the differences between selected and non-selected players: reported are the regression coefficients (B values) and their 95% CI
Table 4. Top five individual tests that best predict selection in terms of classification rate for each age group (logistic regression)
Figure 5. Predicted probability of being selected based on 30 m sprint speed at U10, U11 and U12.
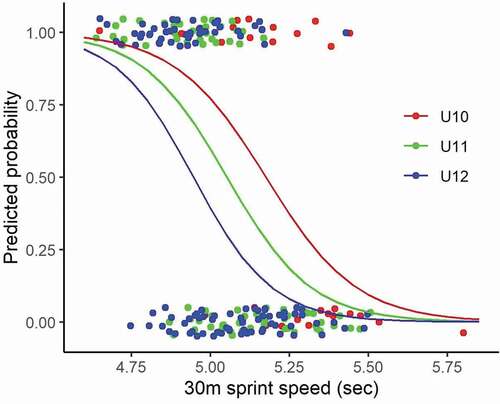
Table 5. Chances of being selected at each age according to 30 m sprint speed
Figure 6. Predicted probability of being selected based on 30 m sprint speed at U12. The vertical bars represent cut-offs above and below which ≈80% of the participants were selected and non-selected respectively (i.e. 4.845 and 5.035 secs) .
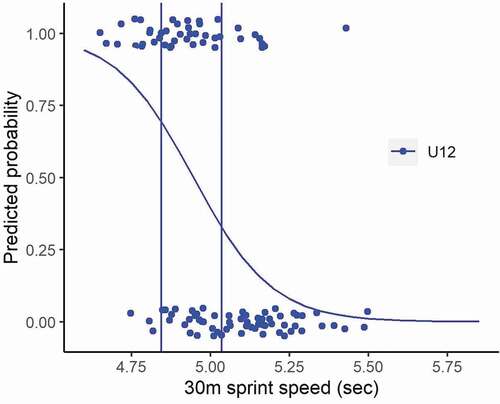
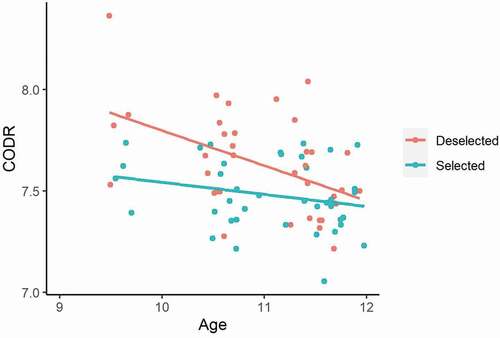
Figure 7. Progression of the Change of direction to the right (CODR) indicator according to age and selection status.