Figures & data
Table 1. Stature, body mass, percentage of predicted adult stature and maturity timing (mean ± SD).
Table 2. Injury counts, incidence rates, mean severity, and injury burden for each age group (95% confidence intervals lower – upper).
Figure 1. a) The estimated injury incidence likelihood compared to growth rate (cm/year), b) The estimated injury burden likelihood compared to growth rate (cm/year) (The black line represents the estimated likelihood and grey shaded area represents the 90% confidence intervals).
Figure 2. The relationship between percentage of predicted adult stature and a) injury incidence, with peak estimated injury likelihood occurring at 91.84%, and b) Injury Burden, with peak risk occurring at 95.24% (The black line represents the estimated likelihood and grey shaded area represents the 90% confidence intervals).
Figure 3. A heat map showing the combined effects of growth rate and percentage of predicted adult stature on estimated a) injury likelihood and b) injury burden.
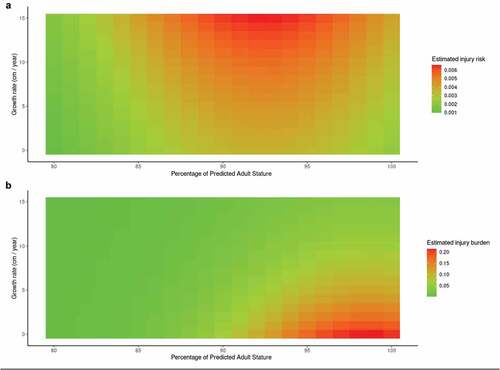
Figure 4. The relationship between lower-limb growth rate (cm/year) and a) the likelihood of injury incidence and b) Injury burden, with peak risk occuring at 5.27 cm/year (The black line represents the estimated likelihood and grey shaded area represents the 90% confidence intervals).
Figure 5. The relationship week-to-week change in exposure and a) the likelihood of injury incidence and B) Injury burden (The black line represents the estimated likelihood and grey shaded area represents the 90% confidence intervals).