8,766
Views
0
CrossRef citations to date
0
Altmetric
Research Article

Ethnic differences in the relationship between step cadence and physical function in older adults

ORCID Icon, , ORCID Icon, ORCID Icon, , ORCID Icon, ORCID Icon, ORCID Icon, ORCID Icon & show all
Pages 1183-1190 | Accepted 18 Mar 2022, Published online: 01 Apr 2022

Figures & data

Table 1. Characteristics of study participants

Figure 1. Estimated marginal mean STS-60 repetitions for White Europeans and South Asians Model 1 (panel 1A) adjusted for: age, sex, height, weight, and fat free mass. Model 2 (panel 1B) adjusted for: model 1 plus slow stepping and brisk stepping.

Figure 1. Estimated marginal mean STS-60 repetitions for White Europeans and South Asians Model 1 (panel 1A) adjusted for: age, sex, height, weight, and fat free mass. Model 2 (panel 1B) adjusted for: model 1 plus slow stepping and brisk stepping.

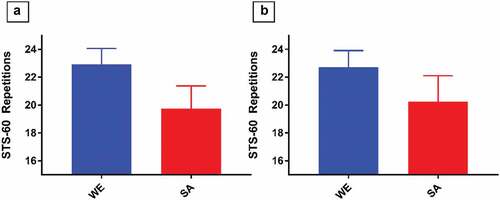
Table 2. Estimated marginal mean difference in STS-60 repetitions between White Europeans and South Asians

Figure 2. Forest plots of relationships between step cadence variables and STS-60 repetitions for White Europeans and South Asians. Model adjusted for: age, sex, height, weight, physical activity category, and accelerometer waking wear time. Slow/brisk steps mutually adjusted. Panel 2A represents relationships between directly measured step cadence and performance in the sit-to-stand-60 (STS-60) in White Europeans. Panel 2B represents relationships between directly measured step cadence and performance in the STS-60 in South Asians. † per 1000 steps, ‡ per decile, § per 10 steps/min.

Figure 2. Forest plots of relationships between step cadence variables and STS-60 repetitions for White Europeans and South Asians. Model adjusted for: age, sex, height, weight, physical activity category, and accelerometer waking wear time. Slow/brisk steps mutually adjusted. Panel 2A represents relationships between directly measured step cadence and performance in the sit-to-stand-60 (STS-60) in White Europeans. Panel 2B represents relationships between directly measured step cadence and performance in the STS-60 in South Asians. † per 1000 steps, ‡ per decile, § per 10 steps/min.

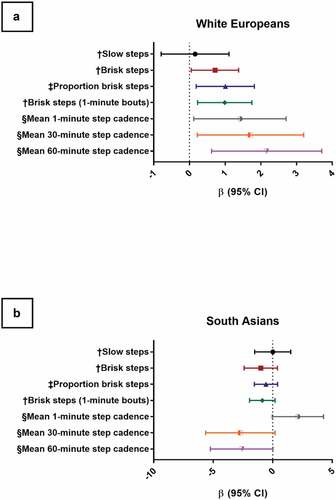
Table 3. Relationships between step cadence variables and physical function for White Europeans and South Asians