Figures & data
Table 1. Current 2D and 3D two-marker methods for estimating foot strike angle are defined and cited below.
Table 2. Participant characteristics are presented as mean ± standard deviation.
Figure 1. The marker placements on the left foot can be seen from a lateral (a) and medial (b) views.
Figure 2. The calculation of the angle of the vector that spans from Marker 1 to Marker 2 is defined in geometric context. X, Y, Z = 3D spatial coordinates of Markers 1 & 2. Marker 1 = proximal marker (i.e., HEEL); Marker 2 = distal marker (i.e., TOE or MET5); θ = foot strike angle.
Table 3. The mean and standard deviation of the foot strike angle determined from three kinematic methods are presented below. V3D-REF = reference method using a visual 3D virtual foot; HEEL-MET5 = two markers (placed on the heel and laterally on the 5th metatarsal); HEEL-TOE = two markers (placed on the heel and superiorly on the 2nd metatarsal).
Table 4. The mean differences, correlation coefficients, and least squares regression statistics are presented comparing both two-marker methods (HEEL-MET5 and HEEL-TOE) for determining foot strike angle against a reference method (V3D-REF).
Figure 3. The regression line (solid) and line of equivalence (dashed) are presented above for both method comparisons: A = V3D-REF vs. HEEL-MET5, B = V3D-REF vs. HEEL-TOE. The foot strike pattern distribution is colour coded: FF = forefoot (green), MF = midfoot (red), RF = rearfoot (blue) .
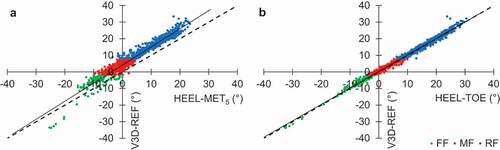
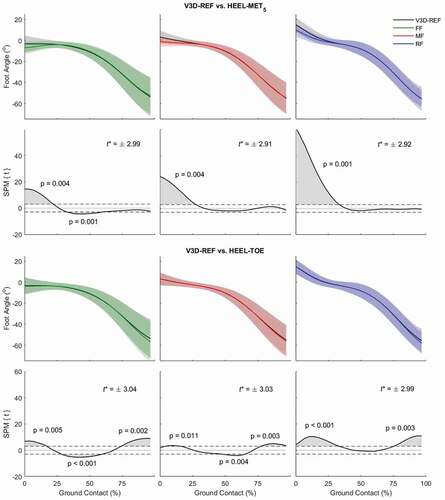
Figure 4. The mean ± SD of the measured foot angle are plotted against the ground contact phase (%) in the first and third rows of graphs (V3D-REF = grey scale; HEEL-MET5 and HEEL-TOE are presented in colour). Positive angles are indicative of dorsiflexion while negative angles of plantarflexion. Each colour corresponds to a foot strike pattern (FF = forefoot (green), MF = midfoot (red), and RF = rearfoot (blue)). Each foot angle graph has a corresponding Statistical Parametric Mapping (SPM) analysis located in the row below it. The critical thresholds (t*) of the SPM analyses are plotted in dashed lines and reported numerically. Shaded areas above the upper t* and below the lower t* are clusters where significant differences exist between the angles measured by the two methodologies (α = 0.025). SPM{t} = t-score continuum across stance phase.