
Figures & data
Table 1. Distribution (percentiles) of study characteristics and overview of outcome domains.
Table 2. Direct calculation of largest and smallest 1%, 2% and 5% of effect sizes across outcome types.
Figure 1. Empirical distribution and modelled outcome-specific standardised mean difference effect size thresholds.
(Below): Black curve is a density plot of the directly calculated empirical effect size values across all outcomes. Small, mid, and large thresholds represent the 0.25, 0.5 and 0.75-quantiles of predicted draws. Black diamonds are based on direct calculation and red intervals illustrate uncertainty in estimates through the median value (circle) and 95% credible interval.
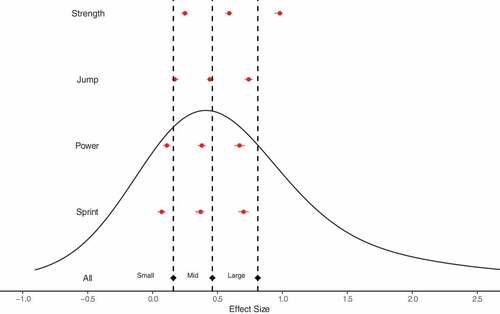
Figure 2. Empirical distribution and modelled outcome-specific percentage improvement effect size thresholds.
(Below): Black curve is a density plot of the directly calculated empirical effect size values across all outcomes. Small, mid, and large thresholds represent the 0.25, 0.5 and 0.75-quantiles of predicted draws. Black diamonds are based on direct calculation and red intervals illustrate uncertainty in estimates through the median value (circle) and 95% credible interval.
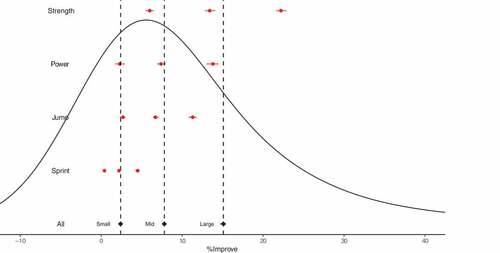
Table 3. Mean and standard deviations of prior distributions for standardised mean difference (SMDpre) and log transformed relative ratio (RR) effect sizes statistics across outcome domains.
Supplemental material