Figures & data
Figure 1. Depiction of the para-biathlon course profile (Panel A: Long-distance race, 2.5 km loop; Panel B: Middle-distance race and Sprint race, 2 km loop without U4 and with D2 replaced by D2alt) with the shooting range and penalty loop sections removed for analyses of skiing pacing strategy.
Table 1. Total Race Time and the proportional contributions of total skiing time, penalty time and shooting time for all race formats.
Figure 2. Heatmap representing the summary of the Pearson correlation coefficients between Section Skiing Time (SST) and Total Skiing Time (TST) as well as between Section Skiing Time (SST) and Total Race Time (TRT) of all laps for all three races.
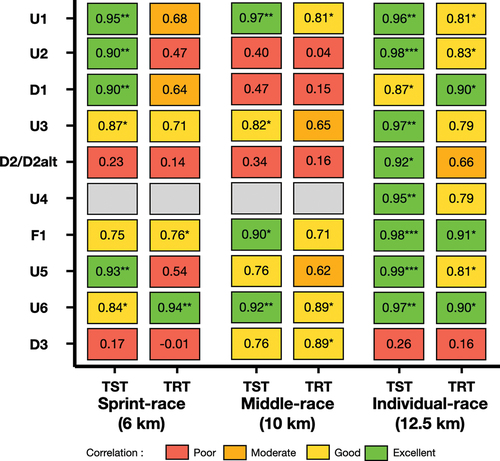
Figure 3. Altitude and “cluster” locations (in green shaded area) for each lap of the Long-distance (Panel A), Middle-distance and Sprint races (Panel B). The associated distance and time gained by the fastest athlete over the slowest athlete is displayed for each cluster as well as the total time gain for the entire lap.
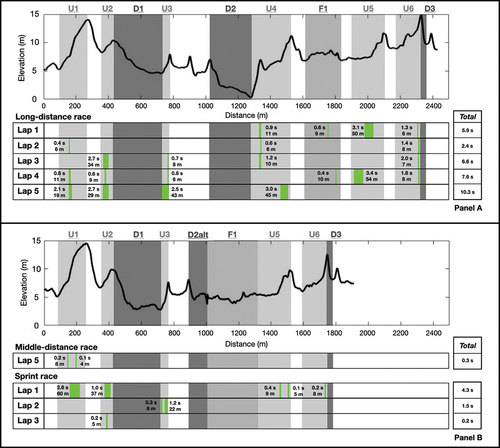
Figure 4. Elevation (Panel A), Statistical parametric mapping (Spm{t}) curve (Panel B) for U6 on lap 2 of the Long-distance race. The shaded area on the SPM{t} curve shows the course location where a significant relationship exists between Total Skiing Time (TST) and instantaneous skiing speed (at 138–146 m). *p < 0.05.