Figures & data
Table 1. Example analysis of winners tactical positioning behaviours ( = 10) using discrete lap analysis and sequence analysis.
Table 2. Most recurring group and winner tactical positioning behaviours in the 500 m, 1,000 m, and 1,500 m events.
Figure 1. Static and dynamic race sequence formation. First, we extract the winner (denoted by the red circle) and group tactical positioning behaviours at the race start and end of each lap. Second, we form our static and dynamic sequences. The static sequence treats the whole race as a single unit of analysis. The dynamic sequences are nested race sequences with a constant endpoint (the final lap) but varying start points (e.g., Lap 1–5, Lap 2–5, Lap 3–5). Note that we represent all sequences using the state-permanence-sequence format, i.e., each successive distinct state in a sequence is given together with its duration. For example, we represent the static winning sequence: (4, 4, 1, 1, 1, 1), as (4, 2) – (1, 4).
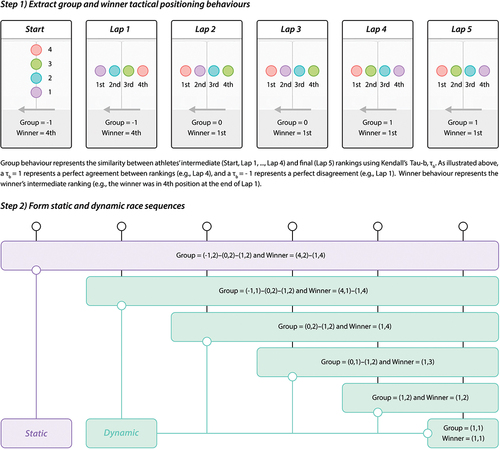
Figure 2. The sequence duplication rate for group and winner tactical positioning behaviours in the 500 m, 1,000 m, and 1,500 m. A sequence duplication rate of 0% indicates that no sequences are identical, and a sequence duplication rate of 100% indicates that all sequences are identical. We report the number of unique sequences detected in the brackets.
Figure 3. Boxplots of sequence relative support for group and winner tactical positioning behaviours in the 500 m, 1,000 m, and 1,500 m. Frequently recurring sequences are identified as those greater or equal to the inner fence: . Annotated sequences represent the most frequent sequence with a relative support ≥ 2%.