Figures & data
Table 1. Basic characteristics of the participants and variables investigated in rearfoot and non-rearfoot runners.
Figure 1. Relationship between ankle joint stiffness and variables describing footfall pattern in rearfoot and non-rearfoot runners (a-c). Figure d shows the relationship between ankle joint stiffness and Achilles tendon thickness. p (BH) – p-value after applying Benjamini-Hochberg correction.
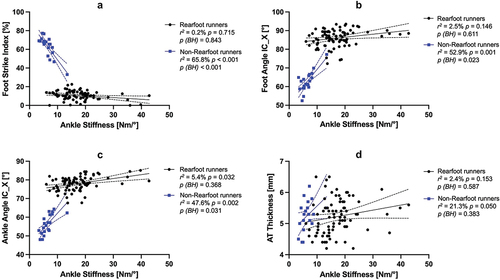
Table 2. The relationship between Achilles tendon dimensions and footfall pattern expressed by a partial correlation coefficient.
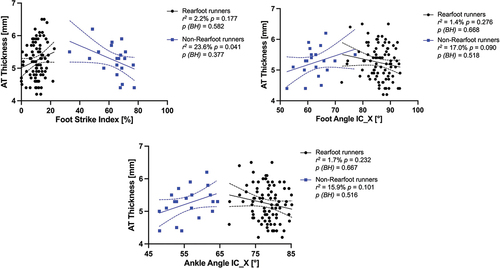
Figure 2. Relationship between Achilles tendonthickness and variables describing footfall pattern in rearfoot and non-rearfoot runners.