Figures & data
Figure 1. Aerial schematic of the laboratory set up during data collection. Left: motion capture cameras were positioned to create a capture volume around the in-ground force platforms over which the subjects completed their sprint running trials. Right: testing protocol order of procedure.
Figure 2. In the sprint gait cycle, leg retraction (forward rotation) begins as the foot leaves the ground and continues up until peak hip flexion. Leg protraction (backward rotation) commences as the hip extends and continues up until toe-off. For each limb, data were obtained as the hip transitioned from flexion (i.e., late retraction) to extension through to toe-off (i.e., protraction phase). Key variables compared between dominant and non-dominant legs in non-fatigued and fatigued sprinting. Vertical centre of mass velocity (vCoM), vertical foot velocity (vfoot), anterior-posterior distance of foot relative to CoM at foot-strike (d), braking impulse (b), propulsive impulse (p), vertical impulse (z).
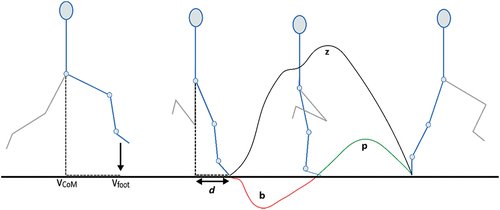
Figure 3. (A) shows peak vertical velocity of the foot (metres per second) relative to the centre of mass velocity between early protraction to foot-strike; (B) anterior-posterior (AP) position of the foot at ground contact relative to the horizontal position of the centre of mass (metres) for the non-fatigued dominant leg (NFDL), non-fatigued non-dominant leg (NFNDL), fatigued dominant leg (FDL), and fatigued non-dominant leg (FNDL). Vfoot represents the vertical velocity of the foot; d represents the anterior-posterior position of the foot relative to CoM at foot-strike. (A)* statistical difference of vertical velocity of the foot relative to CoM velocity, (B)* statistical difference of AP foot position relative to horizontal CoM position between legs and conditions, respectively (p < 0.05).
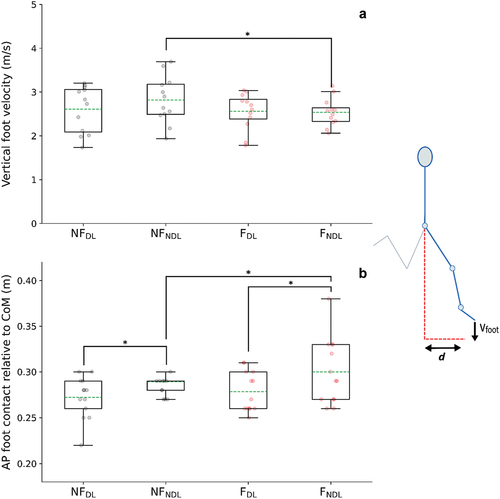
Table 1. Non-fatigued and fatigued braking, propulsive, vertical, and propulsive/braking impulse ratios for dominant and non-dominant legs. *statistical difference between dominant and non-dominant legs trials. ^statistical difference between non-fatigued and fatigued trials, respectively (p < 0.05).
Figure 4. Percentage of total average positive and negative work contributed by the hip (light grey), knee (dark grey), and ankle (black) joints in dominant (DL) and non-dominant (NDL) legs. Significant differences were observed in DL and NDL positive ankle work, negative ankle work, and negative knee work in non-fatigued sprinting, but only in negative knee work in fatigued sprinting, despite statistical increase (#) in DL after fatigue. *statistical difference between legs within conditions. #statistical change between non-fatigued and fatigued conditions (p < 0.05).
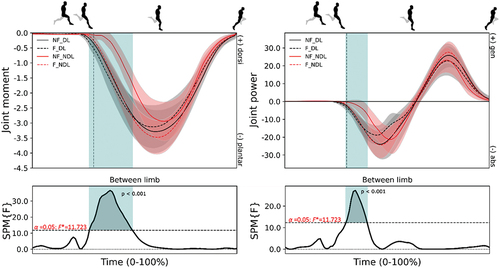
Figure 5. Mean (± standard deviation) joint moments (column 1; N/kg) and powers (column 2; W/kg) at the hip from maximum hip flexion to toe-off for the dominant (DL - black) and non-dominant (NDL - red) legs in the non-fatigued (NF - solid) and fatigued (F - dashed) conditions. Vertical dotted line represents foot-strike. Significant main effects (p < 0.05) of fatigue (green) and between limb (blue) are highlighted during the corresponding periods.
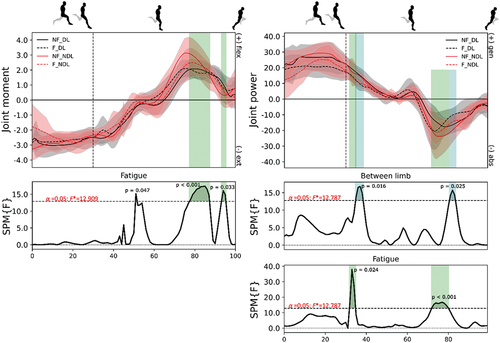
Figure 6. Mean (± standard deviation) joint moments (column 1; N/kg) and powers (column 2; W/kg) at the knee from maximum hip flexion to toe-off for the dominant (DL - black) and non-dominant (NDL - red) legs in the non-fatigued (NF - solid) and fatigued (F - dashed) conditions. Vertical dotted line represents foot-strike. Significant main effects (p < 0.05) of fatigue (green) and between limb (blue) are highlighted during the corresponding periods.
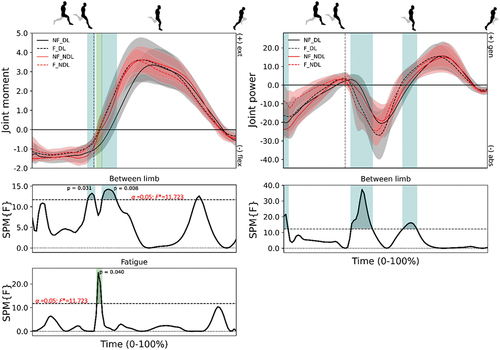
Figure 7. Mean (± standard deviation) joint moments (column 1; N/kg) and powers (column 2; W/kg) at the ankle from maximum hip flexion to toe-off for the dominant (DL – black) and non-dominant (NDL - red) legs in the non-fatigued (NF - solid) and fatigued (F - dashed) conditions. Vertical dotted line represents foot-strike. Significant main effects (p < 0.05) of fatigue (green) and between limb (blue) are highlighted during the corresponding periods.