Figures & data
Table 1. Descriptive statistics of 1247 coach responses for the importance of 18 characteristics and 34 different sports – results presented by means and standard deviations (mean (SD)).
Table 2. Confusion matrix shows the cross validated (leave-one-out) performance (accuracy: 75.1, F1-score: 74.6%) of the CatBoost classifier algorithm of correctly classified cases per sport of 1247 responses in absolute and relative values per sport. The “true label” is defined as the unsupervised machine trained algorithm for each sport. The ”predicted label” is defined as the classification of the leave-one-out response with the “true” algorithm. If “true label” is [sport] than the table shows the [%] accurately predicted responses and the misclassifications for that sport. The shading from light-to-dark shows to what extent the classification of the response is consistent with the “true” sport. The misclassifications for each sport show possible similarities with the “true” sport.
Figure 1. Linear classification plot based on the first two canonical discriminant functions (correctly classified accuracy: 70.2%). Data points (n = 1247) for all sports (n=34) are presented as group centroids and show the clustering of coach responses. The numerical values represent the sports included in the analysis, and the proximity of their centroids indicates the degree of overlap between different sports.
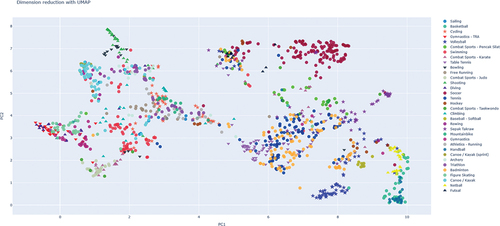
Figure 2. Two-dimension feature space of reduced questionnaire data by UMAP method (correctly classified accuracy: 75.1%). Data points (n = 1247) show the clustering per sport (n = 34). PC1 & PC2 are the principal components of the reduced questionnaire data. The Figure shows the degree of overlap between the 34 different sports.