
Figures & data
Figure 1. Exemplary course of the excess CO2 and DFA-a1 data during the double ramp of one 23-year-old female participant (VO2peak of 49 ml∙kg−1∙min−1). The method of determining VT1 by excess CO2 (blue dots) and HRVT at DFA-a1 value of 0.75 is shown. DFA-a1 (red dots) is displayed over time with areas of linear regression in grey dots. Abbreviations: CO2, carbon dioxide; DFA-a1, alpha1 of detrended fluctuation analysis; HRVT, heart rate variability threshold; VT1, first ventilatory threshold.
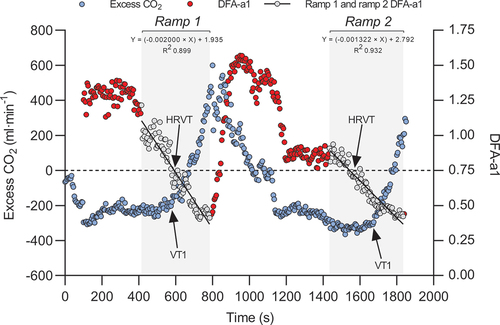
Figure 2. Change in VO2 and HR at gas exchange VT1 (a & c) and HRVT (b & d) for both ramps. Dots represent individual data points, box and whiskers depict the median and interquartile range, and distribution plots represent the distribution of the datapoints. Abbreviations: HR, heart rate; HRVT, heart rate variability threshold; VO2, rate of oxygen uptake; VT1, first ventilatory threshold.
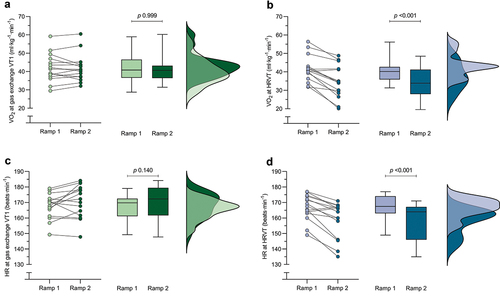
Figure 3. Bland-Altman plots depicting the agreement between VO2 at gas exchange VT1 and HRVT during the first (a) and second (b) ramp, and HR at gas exchange VT1 and HRVT during the first (c) and second (d) ramp. Black dots represent individual data points, black dashed lines represent the 95% limits of agreement. Abbreviations: HRVT, heart rate variability threshold; VO2, rate of oxygen uptake; VT1, first ventilatory threshold.
Table 1. Mean ± standard deviation difference and 95% limits of agreement between the gas exchange and HRVT during both ramps.
Supplemental Material
Download Zip (759.8 KB)Data availability statement
All data used in analyses are provided as a supplementary file.