
Figures & data
Table 1. Sport specific network metric definitions.
Figure 1. Boxplot of pass density for each team in the SSN competition grouped by match outcome. The horizontal line represents the median, the box represents the interquartile range and the whiskers, the range.
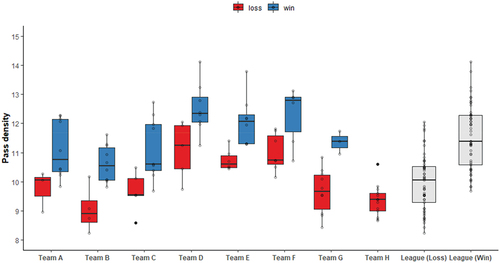
Figure 2. Boxplot of link centrality for each team in the SSN competition grouped by match outcome. The horizontal line represents the median, the box represents the interquartile range and the whiskers, the range.
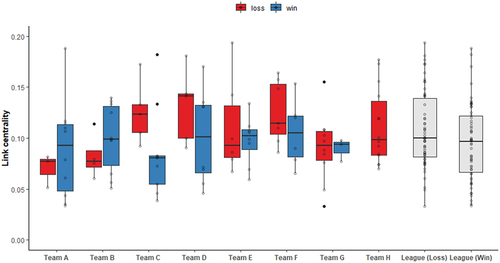
Figure 3. Boxplot of pass centrality for each team in the SSN competition grouped by match outcome. The horizontal line represents the median, the box represents the interquartile range and the whiskers, the range.
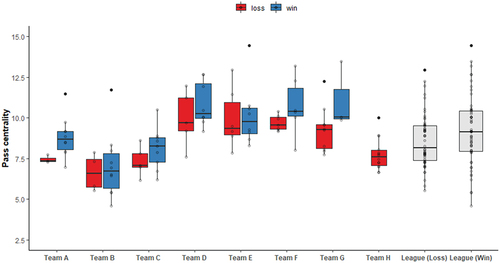
Figure 4. Boxplot of key player centrality for each team in the SSN competition grouped by match outcome. The horizontal line represents the median, the box represents the interquartile range and the whiskers, the range.
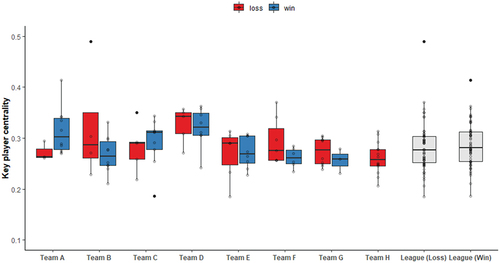
Figure 5. Boxplot of mutual connectedness for each team in the SSN competition grouped by match outcome. The horizontal line represents the median, the box represents the interquartile range and the whiskers, the range.
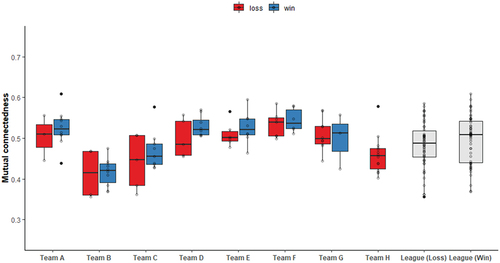
Table 2. Summary table of main effects and interactions for each teamwork characteristic. *Two-way ANOVA results. The effect size is based on the generalised eta squared; 0.02 (small), 0.13 (moderate), 0.26 (large).
Table 3. Multiple linear model for all teamwork characteristics. The estimates include 95% confidence interval within parentheses. *=p < .05, **=p < .01, ***=p < .001. Std = standardised.
Table 4. Playing positions in netball and their court restrictions.
Figure 6. A case study example of the passing networks of two teams in a match. the nodes represent players, labelled by playing position and their size provide an indication of the number of passes a player has been involved in. The location in which the players are placed in the graph represents how central a player is to a team’s passing network. The thickness of the lines between the nodes represents the relative number of passes between the players. GK = goal keeper, GD = goal Defence, WD = Wing Defence, C = centre, WA = Wing attack, GA = goal attack, GS = goal Shooter.
Table 5. Network metrics for the teams that appear in . See for the definitions of the network metrics.