Figures & data
Table 1. Classes involved in the high-intensity interval training (HIIT) intervention.
Figure 1. A) the average heart rate (percentage of heart rate maximum) across the intervention for students in a single class. B) the average heart rate (percentage of heart rate maximum) for each week of the intervention. It decreased on average 0.6% each week (p < 0.001). C) the peak heart rate (percentage of heart rate maximum) for each week of the intervention. It decreased on average 0.5% each week (p < 0.001).
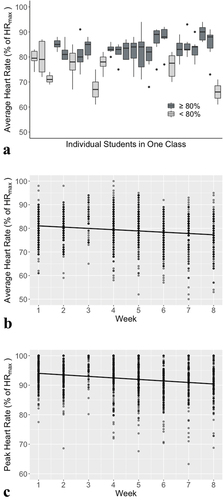
Table 2. Intensity of high-intensity interval training (HIIT) workouts using various heart rate quantifications and session rating of perceived exertion.
Figure 2. The within-person correlation between training impulse calculated with Edwards method using heart rate and session rating of perceived exertion.