
Figures & data
Figure 1. Flow chart illustrating the study selection process.
Table 1. Methodological quality of the included studies using the PEDro rating scale.
Table 2. Participant’s characteristics of the included studies.
Table 3. Characteristics of the included studies.
Figure 2. Forest plot for COD performance.
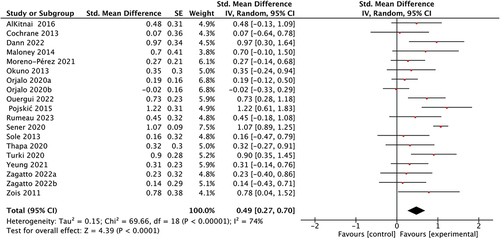
Figure 3. Funnel plot of standard mean difference (SMD) vs. standard error (SE) denoting outliers for the COD outcome.
Figure 4. Forest plot on COD performance based on loading.
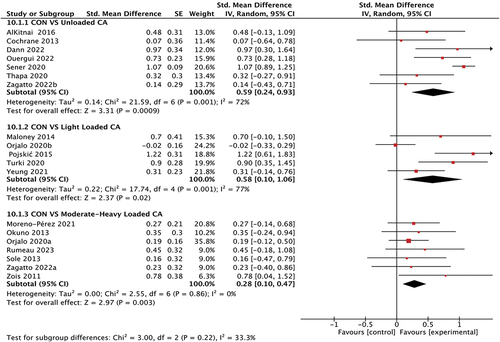
Figure 5. Forest plot on COD performance based on pre-planned and unplanned COD.
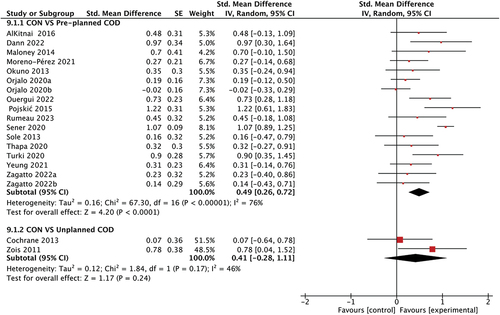
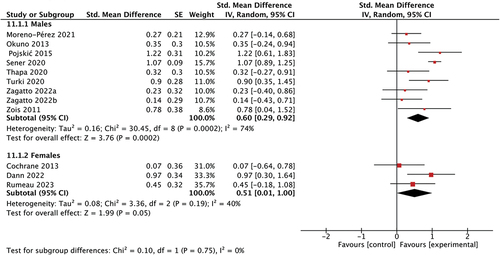
Figure 6. Forest plot on COD performance based on gender.
Supplemental material