Figures & data
Figure 1. Left: Laboratory setup. All sidestepping trials executed to the left side were modified to match the right sidestepping trials by using the left leg as the EXEC leg and touching force plate 1 during the EXEC contact. The black trapezium represents the pelvis segment with the four pelvis markers that were used to calculate the pelvis centre at the initial touch-down of the EXEC contact. The green coordinate system represents the global reference frame. Right: 3D position of the lower-body markers on the pelvis, thighs, shanks and feet.
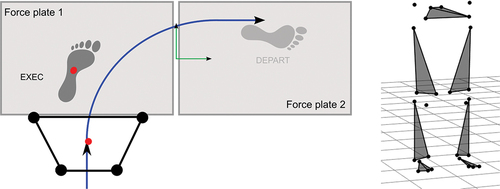
Figure 2. Workflow of training and testing a Kohonen self-organizing map with 3D marker trajectories, leading to the selection of the best matching neuron and its quantization error.
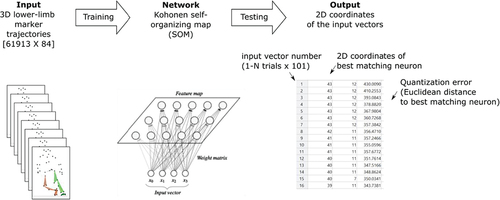
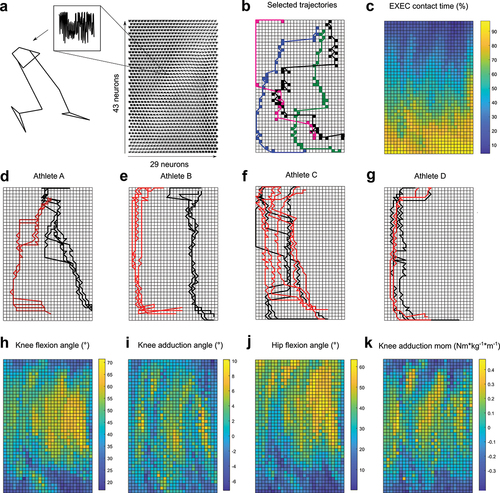
Figure 3. Results gained with the trained SOM. a) plane plot of the SOM showing the content of the single neurons that can be reconstructed into a stick figure b) movement trajectories of four selected athletes, showing distinct paths on the SOM. The coloured squares indicate the neurons that were hit by the athlete’s movement trajectory. c) distribution of the timing during the EXEC contact (%) added as a hidden variable to the SOM. The colour change indicates the change of time. d–g) visualization of the movement trajectories of sidestepping trials towards the preferred (black) and non-preferred (red) sides of four randomly selected athletes. h–k) distribution of the knee flexion and adduction angle, hip flexion angle and knee adduction moment added as hidden variables to the SOM. The colour coding represents the value of the respective parameter.