
Figures & data
Table 1. Characteristics of the participants (means ± SD).
Figure 1. Timeline of the investigated study period.
Figure 2. Scores on the different items of the perceived stress test during the pre-season training period.
*Significant difference between males and females, p ≤ 0.05
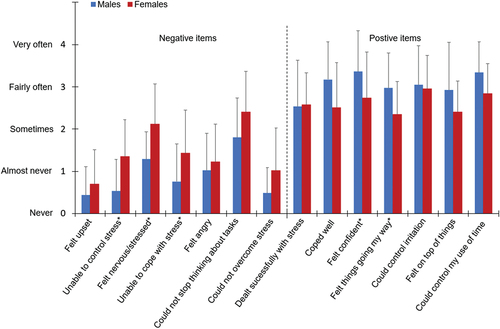
Table 2. Sleep heart rate, duration and latency, perceived level of stress (PSS) and countermovement jump performance (CMJ) by the junior male and female cross-country skiers during the different months of pre-season training.
Table 3. Submaximal running performance, heart rate (HR), blood lactate concentrations (Lac) and rate of perceived exertion (RPE) by the junior male and female cross-country skiers during the different months of pre-season training.
Figure 3. An example of individual changes during a pre-season training period for perceived stress scores (PSS) and rates of perceived exertion (RPE), percentages of maximal heart rate (%HRmax) and blood lactate concentrations during submaximal running in one male (a) and one female (b).
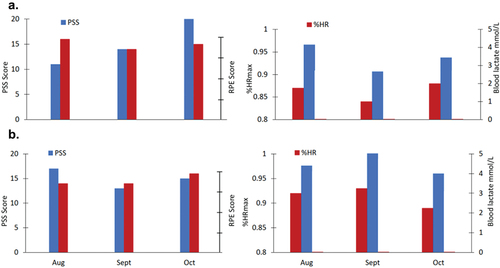
Table 4. Pooled regression estimates of PSS and variables associated with jump performance and their 95% confidence intervals.
Table 5. Pooled regression estimates of SRT variables and their 95% confidence intervals.