
Figures & data
Figure 1. Free body diagram with the average effective anteroposterior net mean force, effective vertical mean force, and the pulling mean force during maximum speed in control (normal) and assisted trials, and during matched (same) speed in the assisted trials. Units in newtons (N).
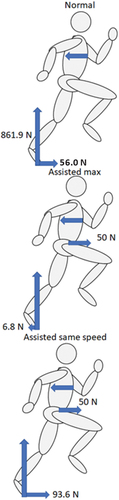
Table 1. Differences between the control (baseline) and assisted trials during the maximum speed phase. Significant difference specified as p value ≤ .050, indicated with bold text and an asterisk.
Table 2. Differences between the control (baseline) and assisted trials during the maximum speed phase in the control and the steps that matched this speed closest in the assisted trial. Significant difference specified as p value ≤ .050, indicated with bold text and an asterisk.
Table 3. Correlation between the change (%) between trials (control vs. assisted) and performance change between trials (running speed) during the maximum speed phase. Significant difference specified as p value ≤ .050, indicated with bold text and an asterisk.