Figures & data
Figure 1. Timeline for data collection over three seasons. All measurement moments included assessment of height, sitting height, weight, CMJ, and mid-pool sprint tests.
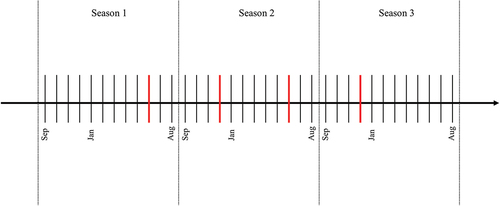
Table 1. Descriptive characteristics of male and female swimmers according to their age category and performance-level group at late junior age.
Figure 2. Mean (indicated with X), interquartile range (indicated with darker colours), minimum and maximum (indicated with lighter colours) observed values on age of peak height velocity (APHV), height and swim training hours for males and females according to performance level at late junior age.
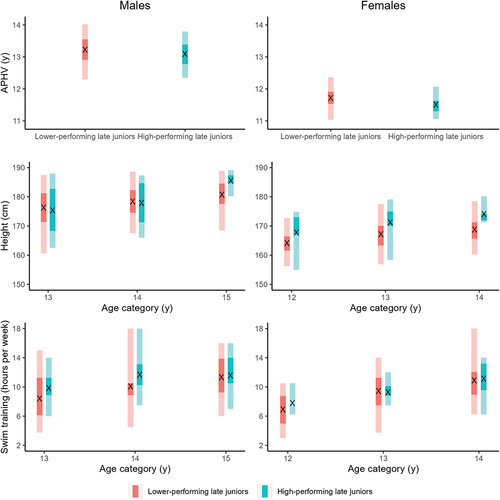
Table 2. Cross-tabulation analyses of the relationship between performance-level group at early and late junior age of male and female swimmers.
Table 3. Model estimates for male (N = 47 with 107 observations) and female (N = 43 with 100 observations) swimmers.
Figure 3. Predicted development as function of age (mean ± SD) of swim performance and underlying performance characteristics in males (N = 47 with 107 observations).
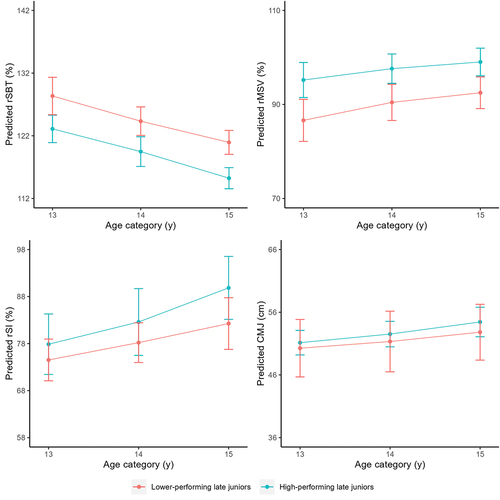
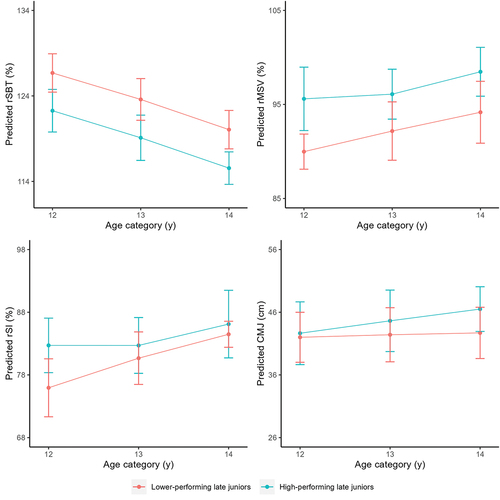
Figure 4. Predicted development as function of age (mean ± SD) of swim performance and underlying performance characteristics in females (N = 43 with 100 observations).