Figures & data
Table 1. Participants self-reported playing positions. WK = wicketkeeper, AR = allrounder.
Figure 1. The observed and expected distributions of all players compared to national norms.
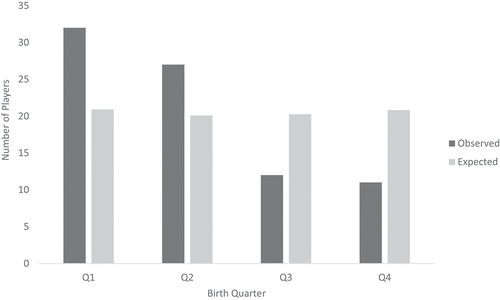
Figure 2. The observed and expected distributions of players by self-reported position compared to national norms.
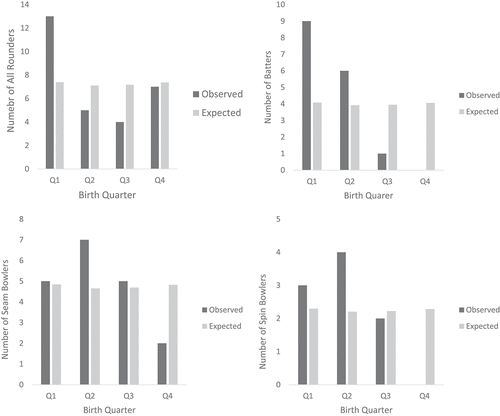
Figure 3. The observed and expected distributions of players by the size of town of birth. The population of London is approximately 8.5–9 million people.
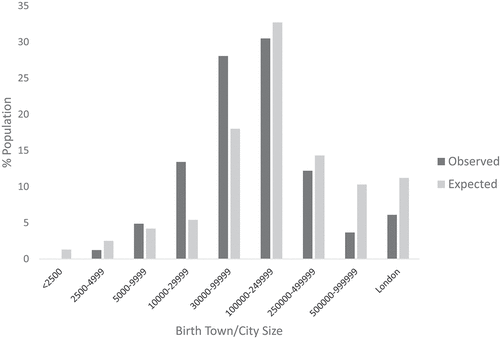
Figure 4. The observed and expected distributions of players by type of school (a) and distributions of players by size of town in which they attended secondary (b) and primary (c) school.
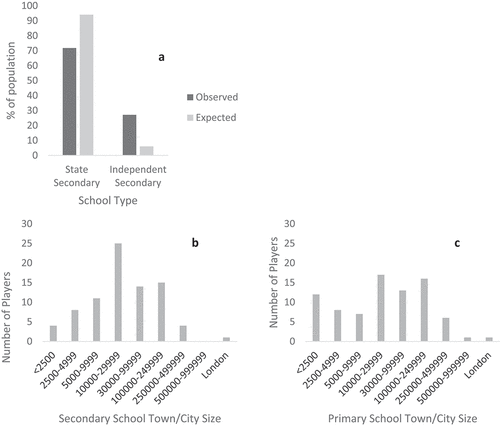
Figure 5. The average (±SE) age at which player’s reached cricketing milestones. Levels of performance increase from left to right, so not all player’s have reached every milestone in the figure.
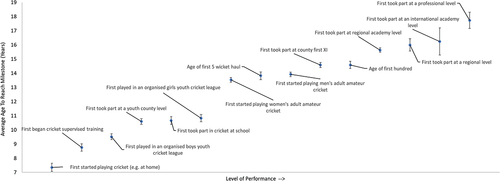
Figure 6. The average hours per year across ages in each of three cricket specific activities (match, practice, play).
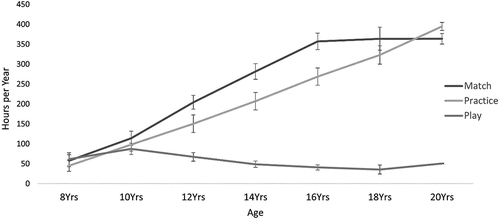
Figure 7. The estimated percentage of time spent playing men’s and women’s cricket across ages.
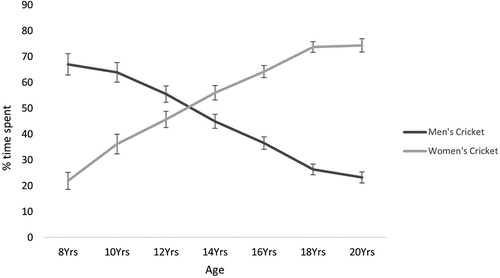
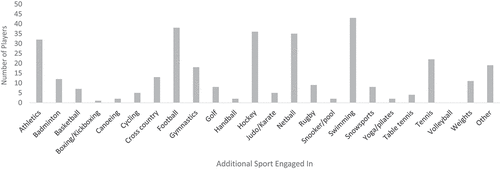
Figure 8. The number of players engaging with specific sports during their cricket development.