Figures & data
Figure 1. Preferred reporting items for systematic reviews and meta-analysis (PRISMA) diagram of the study screening process for examining the effect of acute aerobic exercise on exercise-induced hypoalgesia in healthy participants.
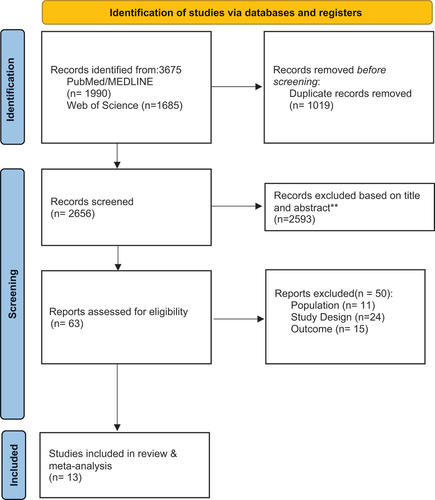
Table 1. Overview included studies including characteristics of participants, exercise and control interventions, and experimental pain measurements. HFmax = maximal heart frequency, HRR = heart rate reserve, MAP = maximum aerobic power, min = minutes, n.A. = not applicable, PPT = pressure pain threshold, RPE = rate of perceived exertion, SD = standard deviation, VO2max = maximum rate of oxygen consumption, W = Watt.
Figure 2. Forest plot of exercise-induced hypoalgesia for local and remote effects, respectively, and the risk of bias evaluation. HFmax = maximal heart frequency, HRR = heart rate reserve, MAP = maximum aerobic power, RPE = rate of perceived exertion, VO2max = maximum rate of oxygen consumption.
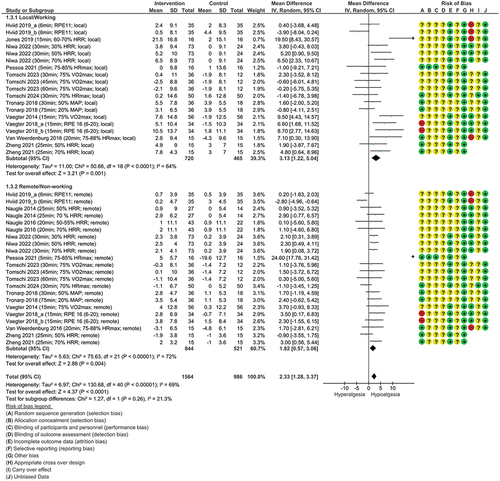
Figure 3. Forest plot of exercise-induced hypoalgesia of different exercise intensities for local effects. HFmax = maximal heart frequency, HRR = heart rate reserve, MAP = maximum aerobic power, RPE = rate of perceived exertion, VO2max = maximum rate of oxygen consumption.
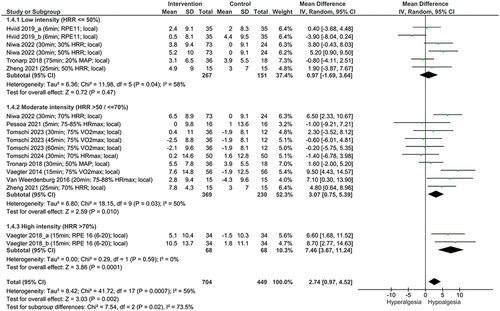
Figure 4. Forest plot of exercise-induced hypoalgesia of different exercise intensities for remote effects. HFmax = maximal heart frequency, HRR = heart rate reserve, MAP = maximum aerobic power, RPE = rate of perceived exertion, VO2max = maximum rate of oxygen consumption.
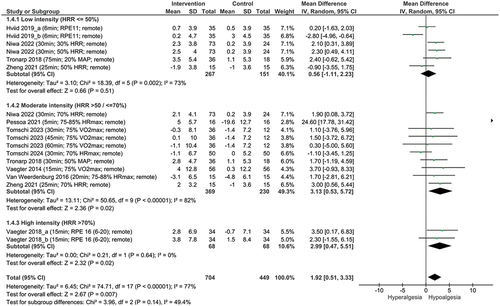
Figure 5. Forest plot of exercise-induced hypoalgesia of different exercise durations for local effects. HFmax = maximal heart frequency, HRR = heart rate reserve, MAP = maximum aerobic power, RPE = rate of perceived exertion, VO2max = maximum rate of oxygen consumption.
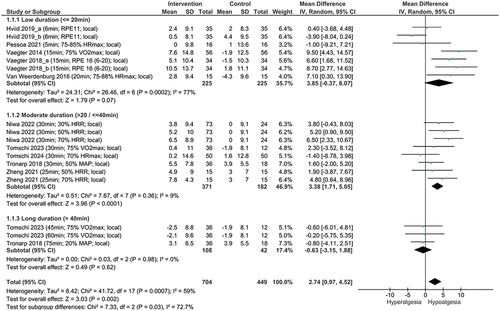
Figure 6. Forest plot of exercise-induced hypoalgesia of different exercise durations for remote effects. HFmax = maximal heart frequency, HRR = heart rate reserve, MAP = maximum aerobic power, RPE = rate of perceived exertion, VO2max = maximum rate of oxygen consumption..
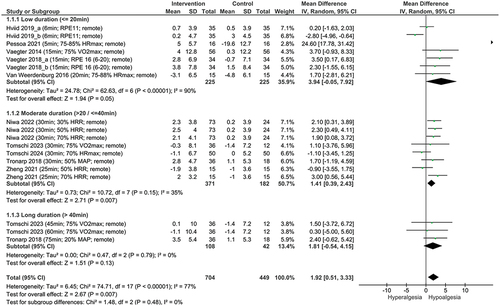
Figure 7. Forest plot of exercise-induced hypoalgesia of different exercise modalities for local effects. HFmax = maximal heart frequency, HRR = heart rate reserve, MAP = maximum aerobic power, RPE = rate of perceived exertion, VO2max = maximum rate of oxygen consumption.
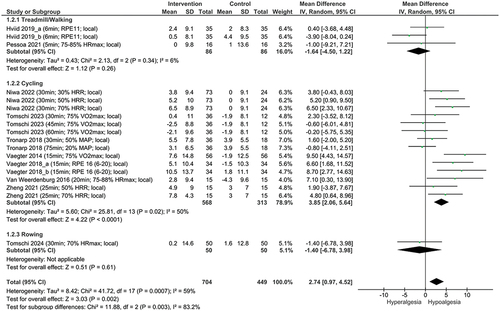
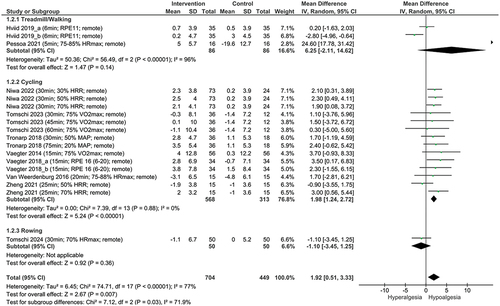
Figure 8. Forest plot of exercise-induced hypoalgesia of different exercise modalities for remote effects. HFmax = maximal heart frequency, HRR = heart rate reserve, MAP = maximum aerobic power, RPE = rate of perceived exertion, VO2max = maximum rate of oxygen consumption..