
Figures & data
Figure 1. Image of “actual” rolling resistance (black line) and rolling resistance based on a static drag test (blue line). This image is adapted from the image reported by Sauret et al. (Citation2013). Note that – in this example – the drag test-based rolling resistance is similar to the average “actual” rolling resistance. However, depending on the upper body pose during deceleration or drag test, this value may be higher or lower.
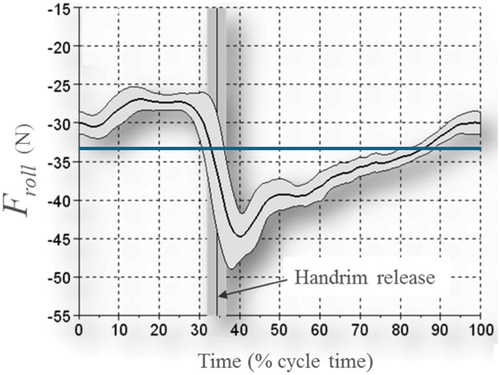
Figure 2. Schematic overview of measurements during different sessions. The “original” treadmill session refers to the condition with no added mass (0 kg) and fully inflated rear wheel tyres (5.25 bar). Mass (i.e., total mass of participant and wheelchair) was assessed on a 1.0 × 1.0-m force plate.
Table 1. Overview of the abbreviations and calculation method of all predictor features and outcome feature that were used in the predictive model.
Figure 3. Typical example of the relative load on the front wheels of the wheelchair (expressed as percentage of the total mass of the wheelchair and user) of a representative subject in the original wheelchair condition during one propulsion cycle (0% representing the start of the push) for propulsion style 1 (no trunk motion at 1.2 m · s−1), style 2 (unrestricted trunk motion at 1.2 m · s−1) and style 3 (unrestricted trunk motion at 1.7 m · s−1).
Table 2. Mean (variation) and range of relative front wheel loads (expressed as percentage (%) of the total load) for all participants per pushing style (characterized by the amount of trunk motion, i.e., TM) in the training and validation set and test set. The range consists of the average front wheel load of the participant with the lowest load and the average front wheel load of the participant with the highest load. The variation is determined by the average of the standard deviations per person. The values are based on 60 s of propulsion per pushing style per person.
Table 3. The results in terms of mean error (ME), mean absolute error (MAE) and root-mean-squared error (RMSE) of the five model types that were trained to predict the front wheel load as a percentage of the total mass of wheelchair and user (i.e., RFWL). Models were trained on the training set (with default hyperparameters) and evaluated on the validation set for which the results are shown.
Figure 4. Gold standard rolling resistance (black line), load distribution model-based rolling resistance (purple line) and drag test-based rolling resistance (dotted line) for the “original” condition, condition with −3.5 bar tyre pressure and condition with +5 kg added mass.
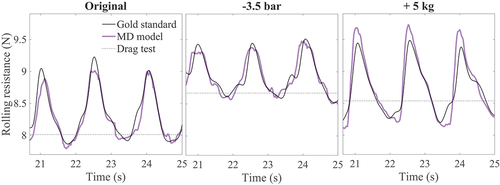
Table 4. Comparisons between the accuracies of the load distribution model-based rolling resistance (Froll,LD model) and the drag test-based rolling resistance (Froll,drag) based on the “original” condition-data from the test set (pushing style: full trunk motion). Accuracies were determined by comparison with the “gold standard” load pin-based rolling resistance (Froll,gold standard) and expressed in mean error (ME), mean absolute error (MAE) and root-mean-squared error (RMSE). The actual gold standard rolling resistance values are also reported. The measures are given for each subject in the test set.
Table 5. Comparisons between the accuracies of the load distribution model-based rolling resistance (Froll,LD model) and the drag test-based rolling resistance (Froll,drag) based on the “−3.5 bar” and “+5 kg” condition-data from the test set (for each pushing style). Accuracies were determined by comparison with the “gold standard” load pin-based rolling resistance (Froll,gold standard) and expressed in mean error (ME), mean absolute error (MAE) and root-mean-squared error (RMSE). The actual gold standard rolling resistance values are also reported.
Data availability statement
The raw data supporting the conclusions of this article are publicly available at 10.4121/bc9a8588-5e50-4dff-aa77-5114ff7626f7.v2. The machine learning model, including instructions on how to use it, is available at 10.4121/c533f919-1a44-48d5–8543-5c7f8be29bb0.