
Figures & data
Table 1. Group means, standard deviations and ranges for ball grip angle, body kinematics at ball release and delivery swing angles.
Table 2. Matrix demonstrating the number of trials for each participant included in each cluster for outswing deliveries.
Table 3. Matrix demonstrating the number of trials for each participant included in each cluster for inswing deliveries.
Figure 1. Outswing scatterplots of kinematic variables and clusters. In the labelling on the scatterplots, “P” pertains to “participant” and the subsequent number is the ID of each participant.
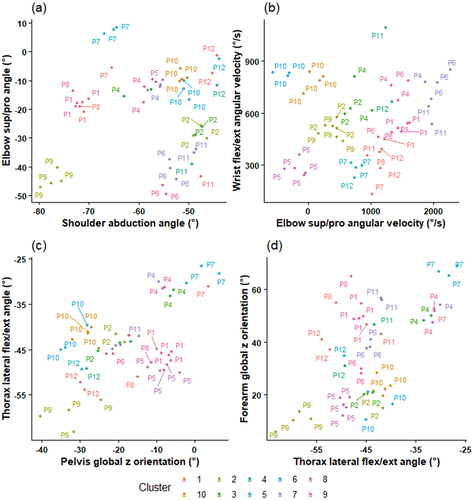
Figure 2. Inswing scatterplots of kinematic variables and clusters. In the labelling on the scatterplots, “P” pertains to “participant” and the subsequent number is the ID of each participant.
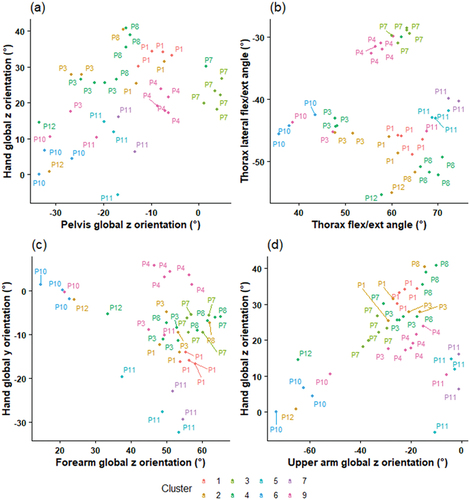
Table A1. Individual participant ranges for ball grip angle, body kinematics and delivery swing angles for outswing trials.
Table A2. Individual participant ranges for ball grip angle, body kinematics and delivery swing angles for inswing trials.