
Figures & data
Figure 1. PRISMA flow diagram of systematic article search and selection (Moher et al., Citation2009).
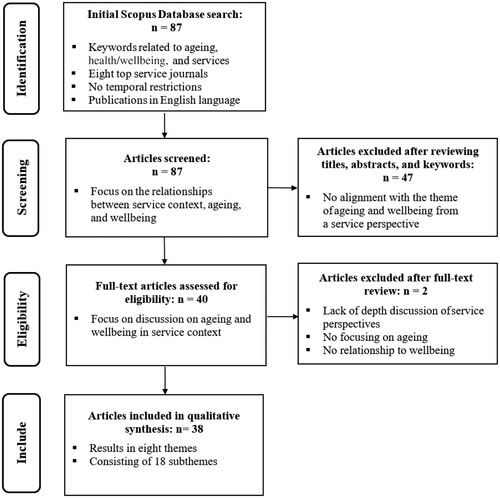
Figure 2. Service Ecosystem ‘Wellbeing of the Ageing Population’ ̶ Themes and System Levels.
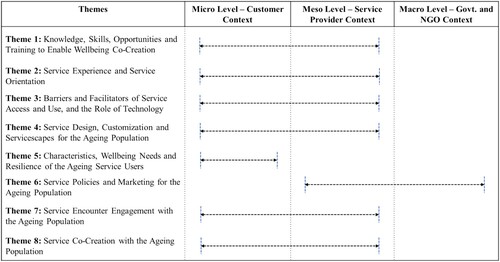
Figure 3. Keyword co-occurrence network (Source: VOSviewer).
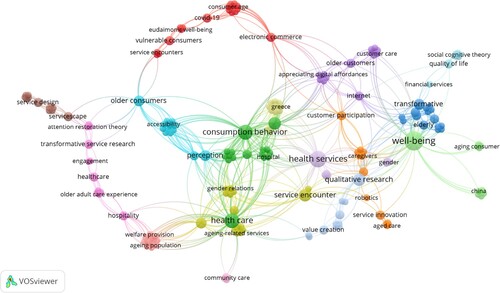
Table 1. Thematic analysis vs bibliometric analysis
Figure 4. Temporal keyword co-occurrence map (1989–2023) (Source: VOSviewer).
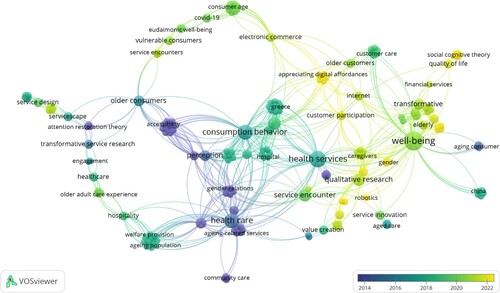
Figure 5. Detailed Overview of Actors across System Levels in the Service Ecosystem ‘Wellbeing of the Ageing Population’.
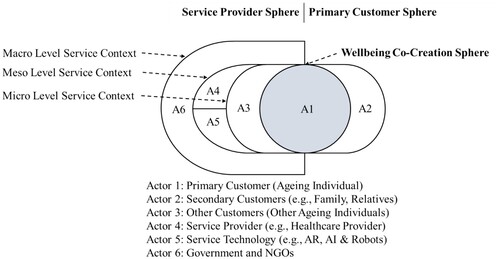
Table 2. Examples of future TSR priorities for the ageing population.
Supplemental material