Figures & data
Figure 1. Two factors, one measurement: insufficiency of additive factors. Possible manner in which two experimental factors, F and G, could affect single measurement (M AB ) of two modules, A and B (Panel A1), or of a single module, C (Panel A2). The functions a, b, and c describe processes performed by modules; u, v, and w are measurement functions (or constants that control linear measurement functions in the discussion of Sternberg's, Citation2011, additive factors in the text). Example data when F (with three levels) and G (with two levels) have additive effects (Panel B1), and how these data are explained by linear measurement of the single module C, whose output, c(E), is a linear function of E, itself a linear combination of F and G (Panel B2; see text). Example data when F and G interact (Panel C1), and how these data are explained by nonlinear (but monotonic) measurement of a single module whose output is a linear function of F and G (Panel C2). Example data when F and G show a cross-over interaction (Panel D1), and how these data are explained by linear measurement of a single module, whose output is a nonlinear function of F and G (Panel D2). None of these data patterns therefore constitute evidence against a single module account (according to present framework).
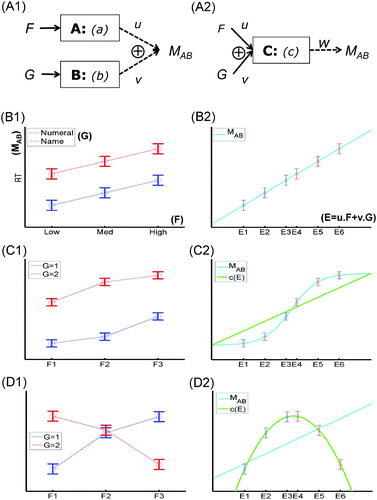
Figure 2. One factor, two measurements: reversed associations. Possible manner in which one experimental factor, F, could affect two independent measurements (M A and M B ) of two modules A and B (Panel A1), or a single module C (Panel A2). Example data when F (with three levels) has opposite effects of M A and M B (Panel B1), which can be explained by two modules (even with linear measurement functions u and v), but can also be explained by different, (non)linear but monotonic measurement functions, w and x, of the single module C (Panel B2). Example data that comprise a reversed association (Panel C1), which monotonic functions M A and M B cannot explain, given only a single module, even if that module implements a nonlinear function of F, c(F) (Panel C2; the cross by the label for M B indicates that this measurement function has to be nonmonotonic in order to fit the data, violating the present assumptions). This data pattern therefore does constitute evidence against a single module account (see text).
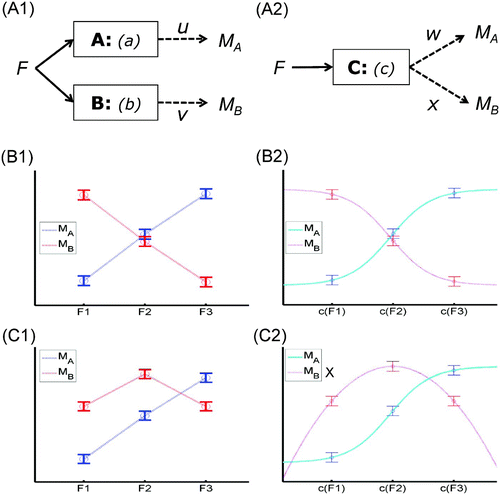
Figure 3. Possible neural implementations of Modules A, B, and C. Greek letters α, β, χ1, and χ2 refer to distinct neural components (processors). Two modules implemented by two separate processors (Panel A1); the same module implemented by two separate processors (Panel A2); two modules implemented within the same processor (Panel B1). In the example of functional magnetic resonance imaging (fMRI) data in the text, B 1 and B 2 refer to the neural-to-BOLD (BOLD = blood-oxygen-level-dependent) mappings (monotonic measurement functions) for spatially resolvable brain regions R 1 and R 2. Panel B2 is a replotting of the reversed association data in -C1, but now as BOLD signal in one region against that in another; the fact that these data points do not fall on a monotonic function again suggests that a single module (Panel A2)—that is, the same process that happens to be implemented across multiple processors—is unlikely.
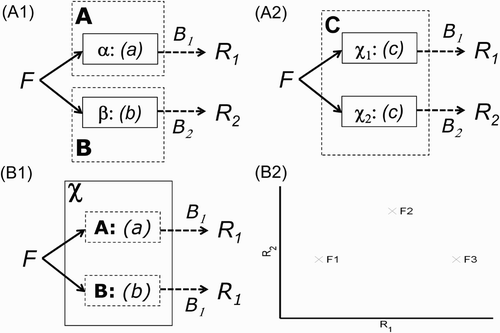
Figure 4. Two factors, two measurements: selective effects on two brain regions. Two modules implemented by two separate processors (Panel A1); the same module implemented by two separate processors (Panel A2). Example neuroimaging data where measurement R 1 of one region shows a main effect of Factor G but not Factor F (Panel B1), and measurement R 2 of a different region shows a main effect of F but not G (Panel B2). These data (accepting null hypotheses of no effects) are evidence against a single module C—that is, a single nonlinear function c(F,G) = c(E), where E is a linear function of F and G—even with different neural-to-BOLD (BOLD = blood-oxygen-level-dependent) mappings (measurements) in the two regions (Panel C1; the cross by the label for R 2 indicates that this measurement function has to be nonmonotonic in order to fit the data, violating the present assumptions). This is again illustrated by fact that a plot of BOLD signal in two regions against one another (Panel C2) cannot be fitted by a monotonic function (see text).
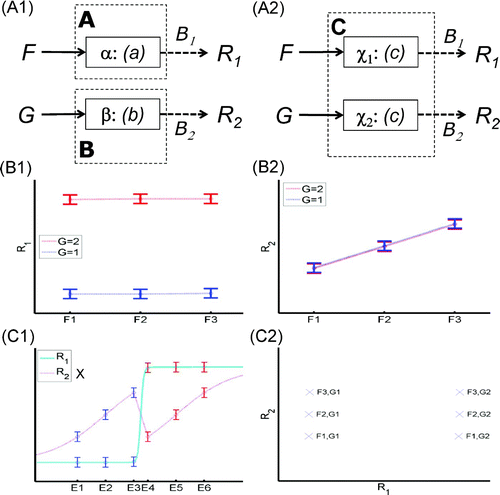
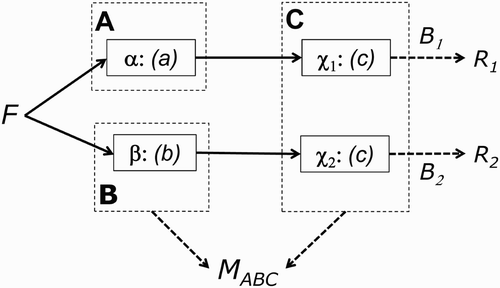
Figure 5. Example network of modules, where different inputs to Module C, by virtue of different “upstream” modules A and B, mean that a reversed association between Factor F and measurements of two regions R 1 and R 2 (or any other discriminative data pattern considered in ) does not constitute evidence that regions χ1 and χ2 implement distinct modules, only that at least two different modules exist somewhere within the network including, or upstream of, χ1 and χ2 (see text). Note that the arrows between α and χ1, and between β and χ2, refer to the direction of causal influence (but not to a specific form of temporal interaction, e.g., staged or cascaded)—that is, a feedforward architecture here. In the alternative case of bidirectional arrows—that is, a fully interactive architecture where the outputs of Process c could also affect the outputs of Processes a and b—the same reversed association across measurements R 1 and R 2 would only constitute evidence of more than one module somewhere in the network (i.e., could arise from any two processors whose influence could be traced directly or indirectly to χ1 and χ2; see text).