Figures & data
Table 1. Key criteria, terms, and heuristics related to capturing specific abilities
Figure 1. Schematic description of three main memory tests. In the learning phase, shown at left, the participant learns novel target stimuli. In the test phase, shown at right, the participant identifies the target stimulus amongst distractors. See text for details of each test. Stimuli shown in a and b are different from, but chosen to be representative of, those used in the actual tests. To view a colour version of this figure, please see the online issue of the Journal.
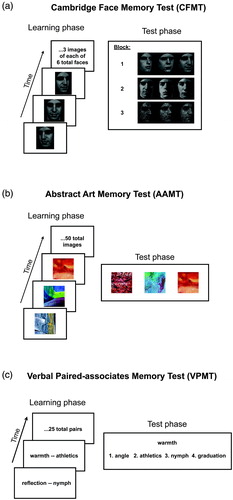
Figure 2. Reliability and item analyses. Split-half correlations (left column), standard item analyses (middle column), and modified item analyses (right column) for the Cambridge Face Memory Test (CFMT; top row), an Abstract Art Memory Test (AAMT; middle row), and a Verbal Paired-Associates Memory Test (VPMT; bottom row), plotted with data from the normative sample described in Section 4. Graphs A–C plot the relationship between the two halves of each test (even items on y-axis plotted against odd items on x-axis). In these graphs, the line shown plots x = y. Graphs D–F plot results of a standard item analysis. In these graphs, item correlations (y-axis; correlation between item and rest of test) are plotted against item difficulty (x-axis; proportion of persons answering that item incorrectly). The horizontal lines in Graphs D–F indicate statistical significance (p = .05, two-tailed), and the vertical lines indicate the midway point between ceiling and chance performance (the so-called psychometric sweet spot; see text). Different dot shades in Graph D indicate CFMT's Blocks 1 (light grey), 2 (dark grey), and 3 (black). Graphs G–I show results of a modified item analysis, designed to highlight how a single item can discriminate differently at different ability levels. Graphs G–I are in most ways identical to Graphs D–E; the x-axis is the same, and the y-axis is also the same except that performance on the rest of the test is dichotomized at a given percentile cut-off (this focuses the analysis on the ability level represented by that percentile cut-off). Axis ranges in all Graphs D–I are the same.
Figure 3. Convergent validity. (A–C) Schematic descriptions of tests that establish convergent validity (see text for full details). (D–F) Performance on tests from A–C is plotted against performance on the test whose convergent validity it establishes. Dots in D are jittered slightly over the range plus-or-minus half an item correct, for improved visibility of individual data points. Least-squares line is drawn. The data plotted in F were originally reported by Woolley and colleagues (2008). Stimulus shown for FFMT is different from, but chosen to be representative of, the image of Audrey Hepburn used in the actual test. CFMT = Cambridge Face Memory Test. AAMT = Abstract Art Memory Test. VPMT = Verbal Paired-Associates Memory Test.
Figure 4. Discriminant validity. Performance on the Cambridge Face Memory Test (CFMT) is plotted against performance on (A) an Abstract Art Memory Test (AAMT) and (B) a Verbal Paired-Associates Memory Test (VPMT). For improved visibility of individual data points, dots are jittered slightly over the range plus-or-minus half an item correct. Least-squares lines are drawn.
Figure 5. Specificity of face recognition ability. Convergent and discriminant validity correlations from and are plotted here in terms of variance explained to demonstrate the Cambridge Face Memory Test's (CFMT's) specificity. Labels and pictures below each bar indicate the two tasks correlated. Error bars are ±1 SE. Horizontal lines above each bar indicate the upper bound on variance explained set by the reliability of the tests being correlated. Since the Code Learning Memory Test's (CLMT's) reliability is not known, upper bound for rightmost correlation is estimated as the Verbal Paired-Associates Memory Test's (VPMT's) reliability. The substantial independence of CFMT from the Abstract Art Memory Test (AAMT) and VPMT, and CFMT's high association with the Famous Faces Memory Test (FFMT), indicate the combination of acute discriminant validity and high convergent validity necessary to demonstrate that an ability is specific. OSMT = Object and Scene Memory Test. Critically, CFMT's strong dissociations with AAMT and VPMT can be explained neither by poor reliability, as the upper bounds on left two correlations are high, nor by poor convergent validity for AAMT or VPMT, as each shows substantial association with a theoretically related task designed to demonstrate its convergent validity. OSMT = Object and Scene Memory Test.
Figure 6. Norms. Data from our large normative data set (n = 1,471) are plotted. This data set is provided in its entirety, in item-by-item form, as supplementary information. X-axes for all graphs in each column are shown below C and F; Y-axes for all graphs in each column are shown beside B and E. (A–C) Overall distributions with best fitting normal curve. (D–F) Data plotted by age and sex, with females in black and males in grey. Vertical lines indicate standard deviation for each data point. For visibility, lines are plotted up for females and down for males. Each dot indicates mean performance either at a single age or over several binned ages. Ages were binned when a single age had fewer than 35 participants, starting from the age of the youngest participant (9) and working upward. Horizontal position of dot indicates the mean age in that bin. Dots are drawn with areas proportional to the number of persons for that dot. CFMT = Cambridge Face Memory Test. AAMT = Abstract Art Memory Test. VPMT = Verbal Paired-Associates Memory Test.
Figure 7. Item response function. Item performance plotted against ability level for three illustrative items in the Cambridge Face Memory Test
(CFMT): one hard item (black), one easy item (light grey), and one item of moderate difficulty (dark grey). Each dot represents the performance of all individuals of a particular ability level on one of these three items. Ability level is computed as proportion correct on CFMT, excluding the item being looked at. Item performance is computed as the proportion of individuals at a given ability level who answered that item correctly. Dots are drawn with area proportional to the number of persons with that ability level. Ability levels were binned when necessary so each one contained at least 10 participants, starting from the lowest performing participant (23 of 72 total items correct) and working upward. Where binning occurred, the ability level was averaged across all participants in that bin.
Figure 8. Item response theory (IRT) analyses of ability and precision for individual persons. The large main graphs in A–C plot IRT-derived ability estimates for each individual person on both axes, with ±1 standard error shown as a vertical grey line. The reason for plotting ability level on both axes is to allow the upper and lower extent of the error bars to be read directly on the y-axis in terms of ability level. The small inset graphs in A–C plot the same information as that shown in the large main graphs in A–C, with the same x-axis, but with a different y-axis that shows the standard error directly (still in z score units). The y-axis in these small inset graphs is magnified to emphasize the variation in standard errors among individuals even at a single ability level (each dot is one individual). The graphs in D–F again plot the same information in the same basic format as the large main graphs in A–C, but now in percentile units. The error bars in D–F end at the percentile ability level that would be reached by increasing or decreasing that person's ability estimate, in z score units, by its standard error. Note that while the standard errors in z score units (A–C) tend to expand with increasing distance from the middle range of abilities, the standard errors in percentile units (D–F) tend to contract with increasing distance from the middle range of abilities, a natural consequence of the nonlinear relationship between z score units and percentile units. CFMT = Cambridge Face Memory Test. AAMT = Abstract Art Memory Test. VPMT = Verbal Paired-Associates Memory Test.