Figures & data
Table 1. Demographic and background neuropsychological data for the 10 pure alexic patients included in the current study, ordered from least to most impaired according to high-frequency regular-word reading accuracy
Table 2. Demographic and background neuropsychological data for the 10 semantic dementia patients included in the current study, ordered from least to most impaired according to high-frequency regular-word reading accuracy
Figure 1. Reading-aloud accuracy for 10 pure alexic (PA) and 10 semantic dementia (SD) patients according to frequency and regularity. Error bars represent ± standard error.
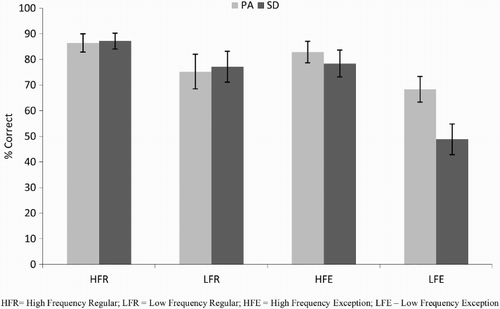
Table 3. Proportion of different error types for the 10 PA and 10 SD cases
Figure 2. Proportion of legitimate alternative reading of components (LARC) and letter (visual + transposition + substitution) errors for the 10 pure alexic (PA) and 10 semantic dementia (SD) patients. Error bars represent ± standard error.
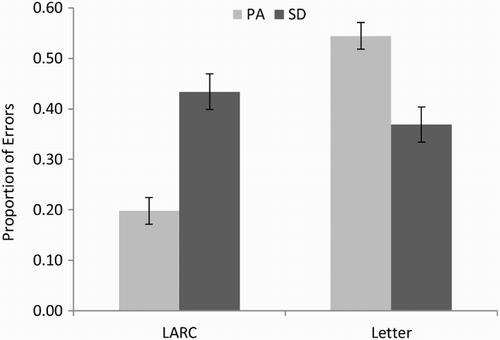
Figure 3. Proportion of word and nonword errors for the 10 pure alexic (PA) and 10 semantic dementia (SD) patients. Error bars represent ± standard error.
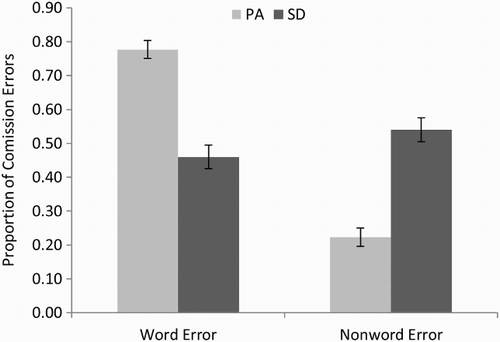
Table 4. Proportion of errors of commission that were phonologically identical to another known word for the 10 PA and 10 SD cases
Figure 4. Visual similarity of letter substitution errors for the 10 pure alexic (PA; left) and 10 semantic dementia (SD; right) patients. Values representation proportion of all substitution errors. [To view this figure in colour, please see the online version of this journal].
![Figure 4. Visual similarity of letter substitution errors for the 10 pure alexic (PA; left) and 10 semantic dementia (SD; right) patients. Values representation proportion of all substitution errors. [To view this figure in colour, please see the online version of this journal].](/cms/asset/a1e62d97-9cfc-4da5-b61b-462c55032d5c/pcgn_a_882300_f0004_c.jpg)
Figure 5. Proportion of consonant substitution errors according to number of phonetic features (place, manner, voice, sonorance) shared between presented and reported phonemes for the 10 pure alexic (PA) and 10 semantic dementia (SD) patients.
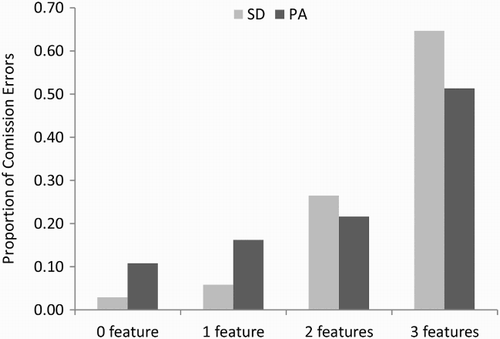
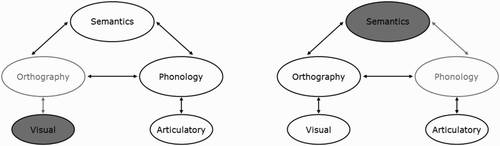
Figure 6. Schematic representation of the loci of deficits undermining reading in pure alexic (PA; left) versus semantic dementia (SD; right) within a triangle model of reading. Filled ovals represent damaged components; grey ovals represent subsequently disrupted processing.