Figures & data
Figure 1. Example of an experimental prime-target pair in all conditions.
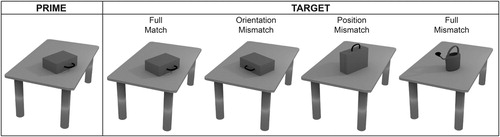
Figure 2. Example trial sequence from the behavioural picture-matching task.
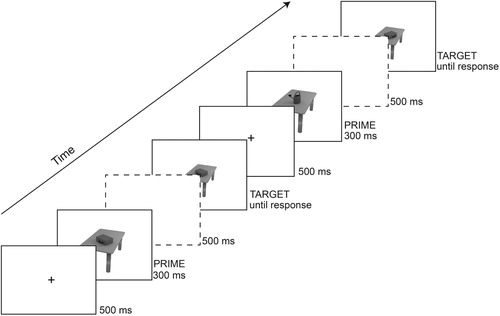
Figure 3. Accuracy (left panel) and reaction times (right panel) per condition, split up by language group. Error bars represent +/− 1 SE.
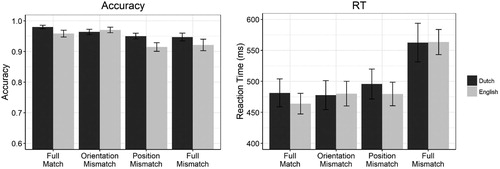
Figure 4. Example trial sequence from the EEG picture-matching task.
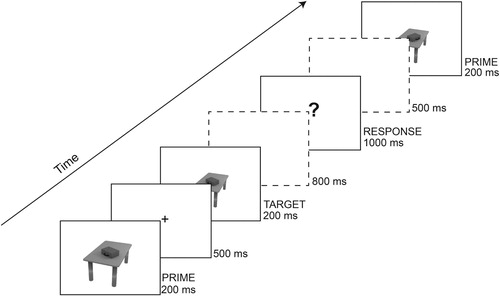
Figure 5. Grand-average ERP waveforms time-locked to target pictures in four conditions at 9 scalp electrode sites in Dutch participants (Experiment 2). Negative is plotted down in all ERP figures.
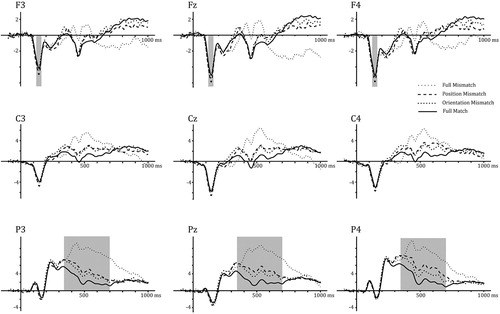
Figure 6. Grand-average ERP waveforms time-locked to target pictures in four conditions at 9 scalp electrode sites in English participants (Experiment 2).
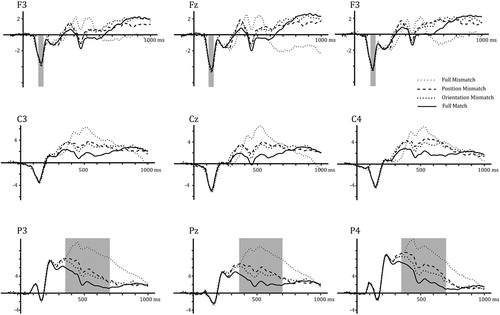
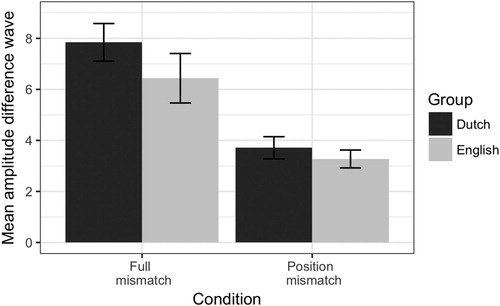
Figure 7. Mean amplitudes for each Condition (Deviant – Standard) per language in the N100 time window (average of a subset of frontal-central electrodes) in Experiment 2. Error bars represent +/− 1 SE.
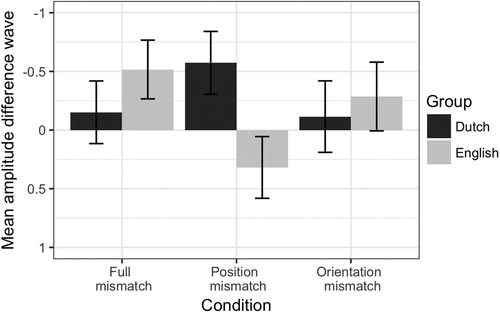
Figure 8. Mean amplitudes for each Condition (Deviant – Standard) per Language in the P300 time window (average of a subset of central-parietal electrodes) in Experiment 2. Error bars represent +/− 1 SE.
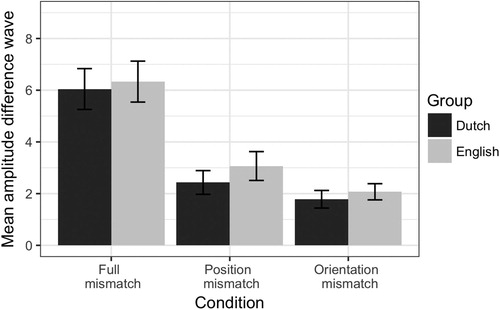
Figure 9. Grand-average ERP waveforms time-locked to target pictures in three conditions at 9 scalp electrode sites in Dutch participants (Experiment 3).
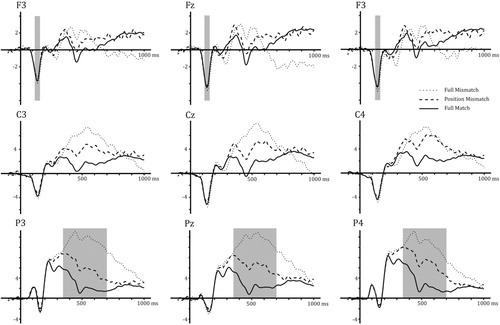
Figure 10. Grand-average ERP waveforms time-locked to target pictures in four conditions at 9 scalp electrode sites in English participants (Experiment 3).
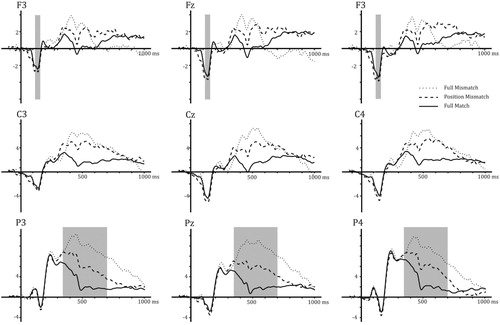
Figure 11. Mean amplitudes for each Condition (Deviant – Standard) and language in the N100 time window (average of a subset of frontal-central electrodes) in Experiment 3. Error bars represent +/− 1 SE.
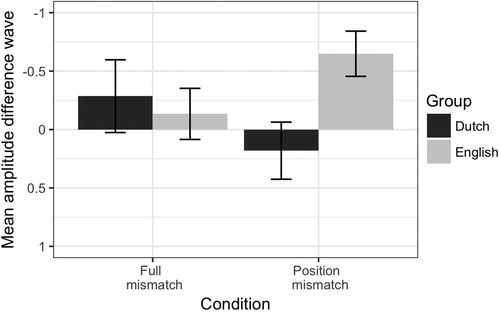
Figure 12. Mean amplitudes for each Condition (Deviant – Standard) and language in the P300 time window (average of a subset of central-parietal electrodes) in Experiment 3. Error bars represent +/− 1 SE.