
Figures & data
Figure 1. M.T.’s MRI, as of April 17, 2015. A T1-weighted structural 3D scan was obtained using a 3T Siemens MAGNETOM Prisma scanner. Bottom right: The sagittal slice through the right hemisphere shows the location of the three horizontal slices, ordered from top left (ventral) to bottom left (more dorsal).
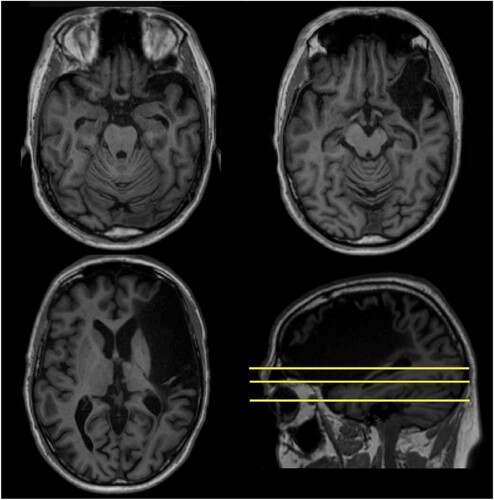
Table 1. Results in the face perception tasks.
Figure 2. Raw test scores of M.T. (red/grey) and control participants (white) in familiar face recognition (BFFT), unfamiliar face recognition (CFMT) and face matching (GFMT). Note different scaling for the different tests. The inner box represents a boxplot with the first and third quantile including the median (thicker line) and two whiskers of 1.5 times interquartile range. The violin plots depict the kernel probability density. [To view this figure in colour, please see the online version of this journal.]
![Figure 2. Raw test scores of M.T. (red/grey) and control participants (white) in familiar face recognition (BFFT), unfamiliar face recognition (CFMT) and face matching (GFMT). Note different scaling for the different tests. The inner box represents a boxplot with the first and third quantile including the median (thicker line) and two whiskers of 1.5 times interquartile range. The violin plots depict the kernel probability density. [To view this figure in colour, please see the online version of this journal.]](/cms/asset/5c002b7c-4900-4bc9-b98b-fb40979156c1/pcgn_a_2119838_f0002_oc.jpg)
Figure 3. Raw test scores of M.T. (red/grey) and control participants (white) in familiar (TFAT familiar) and unfamiliar (TFAT unfamiliar) face processing tests. [To view this figure in colour, please see the online version of this journal.]
![Figure 3. Raw test scores of M.T. (red/grey) and control participants (white) in familiar (TFAT familiar) and unfamiliar (TFAT unfamiliar) face processing tests. [To view this figure in colour, please see the online version of this journal.]](/cms/asset/c824c7bd-5495-4e0b-8a18-bf332077696d/pcgn_a_2119838_f0003_oc.jpg)
Figure 4. d’ test scores of M.T. (red/grey) and control participants (white) in unfamiliar voice recognition. [To view this figure in colour, please see the online version of this journal.]
![Figure 4. d’ test scores of M.T. (red/grey) and control participants (white) in unfamiliar voice recognition. [To view this figure in colour, please see the online version of this journal.]](/cms/asset/3bd738c5-8459-4d6f-a2a9-3b7a18e4eac6/pcgn_a_2119838_f0004_oc.jpg)
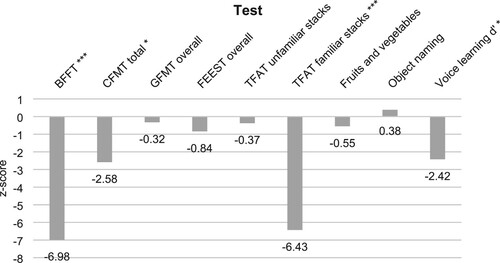
Figure 5. M.T.'s z-scores for face, object and voice processing tests. Please note that positive values signify better performance than the control sample while negative values represent worse performance.
Data availability statement
Where legal conditions do not permit public archiving of anonymized study data, we will grant access to named individuals in accordance with ethical procedures governing the reuse of clinical data, upon completion of a formal data sharing agreement and approval of the local ethics committee. Readers seeking access to stimuli and data are advised to contact the last author. No part of the study procedure or analyses was pre-registered prior to the research being conducted. We report how we determined our sample and sample size, all data exclusions, all inclusion/exclusion criteria, and all manipulations.