
Figures & data
Figure 1. Comparing EG’s reading performance with neurotypical controls. (A) Accuracy (left) and response time (right) during the 1-back VWFA localizer task. (B) Proportion of words typed that matched the words in the target sentence in different speed conditions.
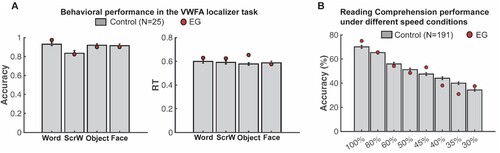
Figure 2. EG’s MRI showing the missing cortex and the parcels for the right and left VWFA and FFA. Top, T1-weighted images in coronal, sagittal, and axial views. Bottom, the VWFA (purple) and FFA (blue) parcels are projected on EG’s reconstructed surface. The parcels served as spatial constraints in defining the fROIs (see Methods), but we also explored the entire VTC for category selectivity (outlined with black solid lines). By design, the parcels are relatively large (to accommodate inter-individual variability in the precise locations of these areas) and therefore can overlap, but the individual fROIs are small and do not overlap. Note that even though part of the anterior lVTC is missing in EG, the stereotypical locations for both the VWFA and FFA are spared.
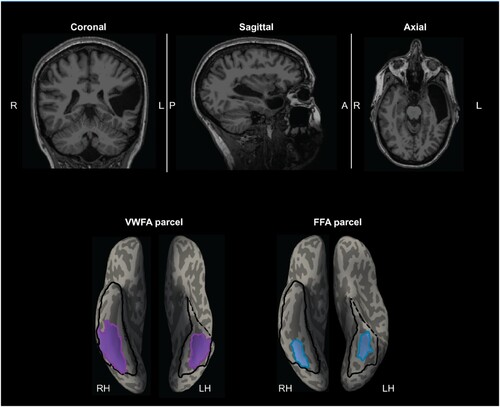
Figure 3. Responses to four conditions in the rVWFA and rFFA for EG and the control group. (A) Bar plots show mean PSCs to the four conditions estimated in independent data within individually defined rVWFA fROIs (i.e., top 10% word-selective voxels within the rVWFA parcel) for the control group. (B) Mean PSCs to the four conditions estimated in independent data within the individually defined rVWFA fROI for EG. Here and in E, the results are averaged across run combinations. (C) Parametrically decreasing the threshold for defining the rVWFA fROI from the top 5% to 50% word-selective voxels within the rVWFA parcel. Number of voxels in the rVWFA fROIs: 5% = 269 voxels, 50% = 2690 voxels. Here and in F, average PSCs across run combinations are shown for each threshold. (D) Mean PSCs to the four conditions estimated in independent data within individually defined rFFA fROIs for the control group. (E) Mean PSCs to the four conditions estimated in independent data within the individually defined rFFA fROI for EG. (F) Parametrically decreasing the threshold for defining the rFFA fROI from the top 5% to 50% face-selective voxels within the rFFA parcel. Number of voxels in the defined rFFA fROIs: 5% = 67 voxels, 50% = 672 voxels. In the bar plots, dots correspond to individual data points for each condition (controls: n = 25 participants; EG: n = 10 run combinations, from ten iterations). Horizontal bars reflect significant paired t-tests p < 0.05. Error bars in both the bar and line plots denote standard errors of the mean by participants (for the control group) and by run combinations (for EG). Words = Written Words; ScrW = Scrambled Words.
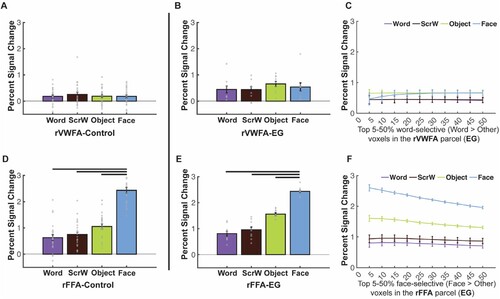
Figure 4. Selectivity indices for EG and controls. Histogram was used to show the visual word selectivity (A, C) and face selectivity (B, D) indices both controls and EG. Each bar represents one participant and participants are ordered by their selectivity indices from lowest to highest.
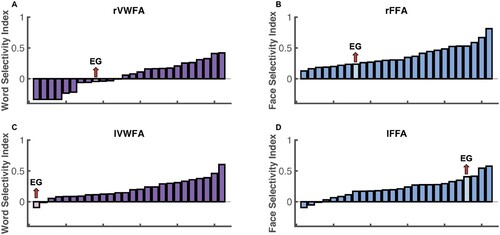
Figure 5. Mean PSCs in the rVTC and lVTC at different thresholds for EG. (A-B) Parametrically decreasing the threshold for defining word-selective (Words > Others) and face-selective (Faces > Others) voxels from the top 1% to 10% within the rVTC. Mean PSCs across run combinations (from 10 iterations) are shown for each threshold. (C-D) Parametrically decreasing the threshold for defining word-selective and face-selective voxels from the top 1% to 10% within the lVTC. Mean PSCs across run combinations are shown for each threshold. Number of selected voxels: rVTC: 1% = 216 voxels, 10% = 2164 voxels; lVTC: 1% = 154 voxels, 10% = 1536 voxels. Words = Written Words; ScrW = Scrambled Words
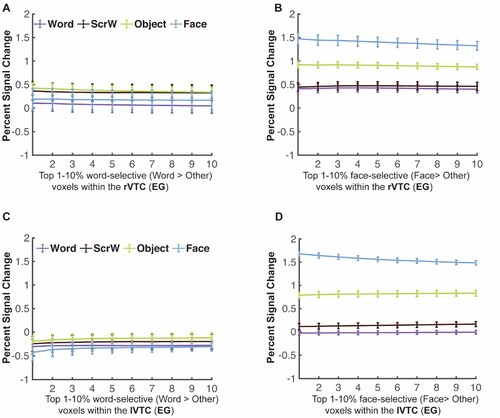
Figure 6. Responses to four conditions in the lVWFA and lFFA for EG and the control group. (A), Bar plots show mean PSCs to four conditions estimated in independent data within individually defined lVWFA fROIs (i.e., top 10% word-selective voxels within lVWFA parcel) for the control group. (B), Mean PSCs to the four conditions estimated in independent data within individually defined lVWFA fROIs for EG. Here and in E, the results are averaged across run combinations. (C), Parametrically decreasing the threshold for defining the lVWFA fROIs from the top 5% to 50% word-selective voxels within the lVWFA parcel for EG. Number of voxels in the defined lVWFA fROIs: 5% = 295 voxels, 50% = 2952 voxels. Here and in F, average PSCs across run combinations are shown for each threshold. (D), Mean PSCs across participants to the four conditions estimated in independent data within individually defined lFFA fROIs for the control group. €, Mean PSCs to four conditions estimated in independent data within individually defined lFFA fROIs for EG. (F), Parametrically decreasing the threshold for defining lFFA fROI from the top 5% to 50% face-selective voxels within the lFFA parcel in EG. Number of voxels in the defined lFFA fROIs: 5% = 70 voxels, 50% = 695 voxels. In the bar plots, dots correspond to individual data points (controls: n = 25 subjects; EG: n = 10 run combinations, from ten iterations). Horizontal bars reflect significant paired t-tests p < 0.05. Error bars in both the bar and line plots denote standard errors of the mean by participants (for the control group) and by run combinations (for EG). Words = Written Words; ScrW = Scrambled Words.
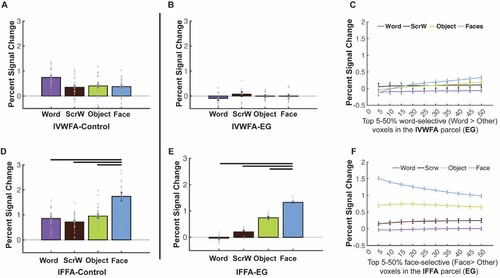
Figure 7. Responses to conditions in both the VWFA and language localizers in the frontotemporal language network for EG. (A-C), Mean PSCs in word-selective voxels (Words > Others) at different thresholds in the right temporal (A), right frontal (B) and left frontal language parcels (C). (D-F), Mean PSCs in language-selective voxels (Words > Others) at different thresholds in the right temporal (D), right frontal (E) and left frontal language parcels (F). Parametrically decreasing the threshold from the top 1% to 10% within each language parcel (i.e., the search space). Mean PSCs across run combinations (from 10 iterations for the VWFA task and 6 iterations for the language task) are shown for each threshold. Error bars denote standard errors of the mean by run combinations for EG. Words = Written Words; ScrW = Scrambled Words. Evis, visually presented English sentences; Nvis, visually presented Nonword sequences; Eaud, auditorily presented English sentences; Naud, auditorily presented Nonword sequences.
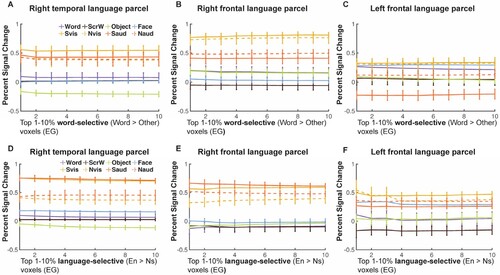
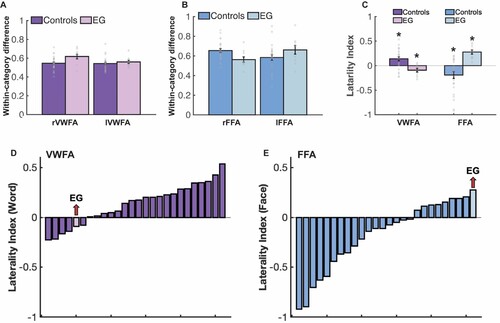
Figure 8. Results of the multivariate pattern analysis (MVPA). (A) Within-category correlation differences between preferred (i.e., Words-Words) and non-preferred (i.e., average within-category correlation of non-word conditions) conditions for EG and the controls in the rVWFA and lVWFA parcels. Here and in B, correlation values were Fisher’s z-transformed. (B) Within-category correlation differences between preferred (i.e., Faces-Faces) and non-preferred (i.e., average within-category correlation of non-face conditions) conditions for EG and the controls in the rFFA and lFFA parcels. (C) Laterality index for the number of multivariate searchlights for VWFA and FFA for both controls and EG. Asterisk (*) denotes significant laterality index (compared to zero). (D-E), Histogram was used to show the word and face laterality indices for both controls and EG. Each bar represents one participant and participants are ordered by their selectivity indices from lowest to highest.
Data and code availability statement
The data and code that support the findings of this study are available from the corresponding author upon request.