
Figures & data
Figure 1. The distribution of naming errors of the Primary Analyses for the differences between target and error values for typicality (Panel A) and number of semantic features (Panel B), and the semantic similarity measure (Panel C). Note. The black dashed line indicates the average difference between target and error for the respective semantic variable.
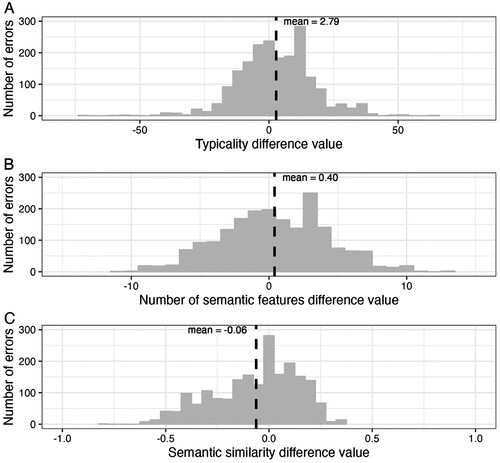
Table 1. Counts and percentage of errors of each error type included in the Primary Analyses.
Table 2. Summarized findings of the Primary Analyses and Supplementary Analyses Sets 1 and 2 with typicality, number of semantic features, or semantic similarity as dependent variables.
Table A1. Response coding with examples.
Table B1. Summary of Primary Analyses linear mixed model for typicality (n = 1966 observations).
Table B2. Summary of Primary Analyses linear mixed model for number of semantic features (n = 1966 observations).
Table B3. Summary of Primary Analyses linear mixed model for semantic similarity (n = 1966 observations).
Table C1. Summary of Supplementary Analyses Set 1 linear mixed model for typicality on coordinate errors (n = 1677 observations).
Table C2. Summary of Supplementary Analyses Set 1 linear mixed model for number of semantic features on coordinate errors (n = 1677 observations).
Table C3. Summary of Supplementary Analyses Set 1 linear mixed model for semantic similarity on coordinate errors (n = 1677 observations).
Table D1. Counts and percentage of errors of each error type included in Supplementary Analyses Set 2.
Table D2. Summary of Supplementary Analyses Set 2 linear mixed model for typicality on all available data points (n = 2349 observations).
Table D3. Summary of Supplementary Analyses Set 2 linear mixed model for typicality on all available coordinate errors (n = 1917 observations).
Table D4. Summary of Supplementary Analyses Set 2 linear mixed model for number of semantic features on all available data points (n = 2349 observations).
Table D5. Summary of Supplementary Analyses Set 2 linear mixed model for number of semantic features on all available coordinate errors (n = 1917 observations).
Table E1. Summary of Supplementary Analyses Set 3 linear mixed model for typicality with separate values for target and response for control variables as fixed effects (analogous to Primary Analyses on data points with complete information for semantic similarity measure, n = 1966 observations).
Table E2. Summary of Supplementary Analyses Set 3 linear mixed model for typicality on coordinate errors with separate values for target and response for control variables as fixed effects (analogous to Supplementary Analyses Set 1 on data points with complete information for semantic similarity measure, n = 1677 observations).
Table E3. Summary of Supplementary Analyses Set 3 linear mixed model for typicality on all available data points with separate values for target and response for control variables as fixed effects (analogous to Supplementary Analyses Set 2, n = 2349 observations).
Table E4. Summary of Supplementary Analyses Set 3 linear mixed model for typicality on all available coordinate errors with separate values for target and response for control variables as fixed effects (analogous to Supplementary Analyses Set 2, n = 1917 observations).
Table E5. Summary of Supplementary Analyses Set 3 linear mixed model for number of semantic features with separate values for target and response for control variables as fixed effects (analogous to Primary Analyses on data points with complete information for semantic similarity measure, n = 1966 observations).
Table E6. Summary of Supplementary Analyses Set 3 linear mixed model for number of semantic features on coordinate errors with separate values for target and response for control variables as fixed effects (analogous to Supplementary Analyses Set 1 on data points with complete information for semantic similarity measure, n = 1677 observations).
Table E7. Summary of Supplementary Analyses Set 3 linear mixed model for number of semantic features on all available data points with separate values for target and response for control variables as fixed effects (analogous to Supplementary Analyses Set 2, n = 2349 observations).
Table E8. Summary of Supplementary Analyses Set 3 linear mixed model for typicality on all available coordinate errors with separate values for target and response for control variables as fixed effects (analogous to Supplementary Analyses Set 2, n = 1917 observations).
Table E9. Summary of Supplementary Analyses Set 3 linear mixed model for semantic similarity with separate values for target and response for control variables as fixed effects (analogous to Primary Analyses on data points with complete information for semantic similarity measure, n = 1966 observations).
Table E10. Summary of Supplementary Analyses Set 3 linear mixed model for semantic similarity on coordinate errors with separate values for target and response for control variables as fixed effects (analogous to Supplementary Analyses Set 1 on data points with complete information for semantic similarity measure, n = 1677 observations).