
Figures & data
Figure 1. Magnetic resonance imaging reveals a complete, isolated agenesis of the corpus callosum with colpocephaly; neurological convention.
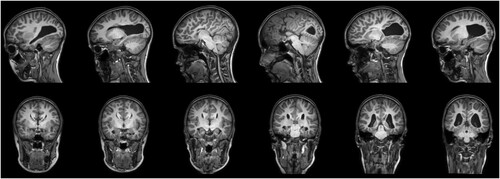
Table 1. Cognitive background information.
Table 2. Spoken language abilities.
Table 3. Orthographic processing
Table 4. Examples of spelling errors.
Figure 2. Treatment schedule.
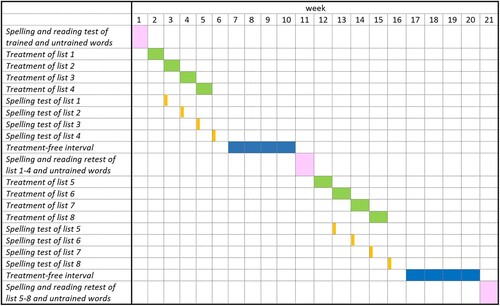
Table 5. Effect of treatment on spelling and reading of irregular words.
Figure 3. (a and b) Pre- and post-treatment white matter connectivity; The colour bar represents the connectivity indices (streamlines per mm3 brain region volume) from blue (connectivity index 0) to yellow (connectivity index ≥3); (c) White matter connectivity changes after treatment. The colour bar represents the pre- to post-treatment changes of connectome indices from blue (connectivity index decreased by -2) to yellow (connectivity index increased by +1). Note: FL, frontal lobe; CC, cingulate cortex; OL, occipital lobe; TL, temporal lobe; PL, parietal lobe; IN, insula.
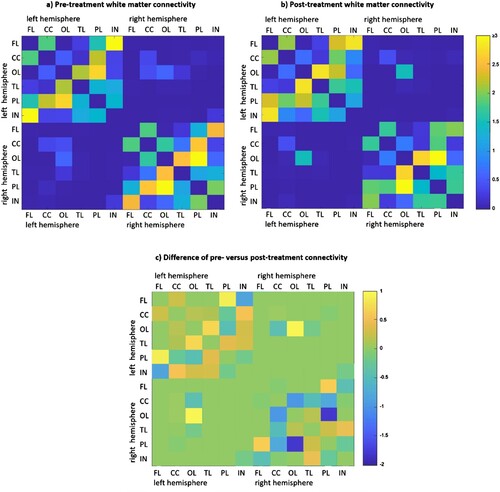
Table 6. Pre- to post-treatment differences of average structural connectivities of each region to all other regions.
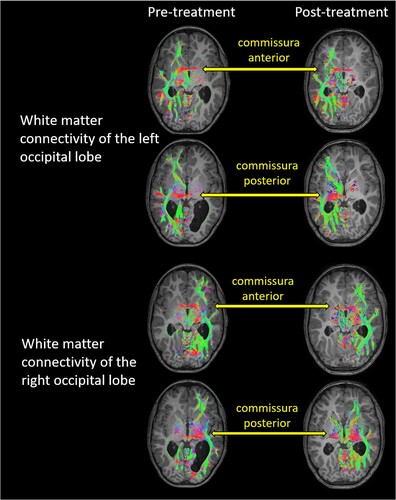
Figure 4. White matter connectivity of the left and right occipital lobes before and after treatment, overlaid on the individual structural T1, neurological convention. The occipital lobes showed connectivity to ipsilateral temporal and frontal brain regions. Interhemispheric connectivity was possible through the anterior and posterior commissure. The colour-coding of tractography pathways is based on a standard red-green-blue (RGB) code that was applied to the vector in each brain area to show the spatial locations of terminal regions of each pathway (red for right-left, blue for cranial-caudal, and green for anterior-posterior). As pre- and post-treatment T1 images were taken at two different measurement time points, the orientation of the head within the scanner was not identical, and slices differed to some degree.
CN-FA 28.23.R4_SUPPLEMENTARY FILE.docx
Download MS Word (340.4 KB)Data availability
Fully anonymized data from this study can be made available on request.