
Figures & data
Table 1. Measures.
Table 2. Psychosocial and demographic characteristics at pre-admission.
Figure 1. Distributions of anxiety scale (EPDS-3A) total scores at pre-admission, discharge, and follow-up.
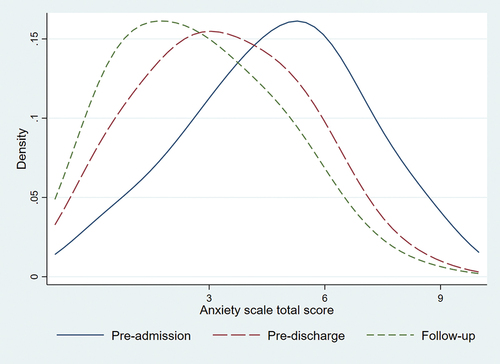
Table 3. Anxiety scale total scores and categories.
Table 4. Models predicting the reduction of EPDS-3A anxiety scores.
Figure 2. Distributions of FAS fatigue scores at pre-admission and 6-week post discharge (follow up).
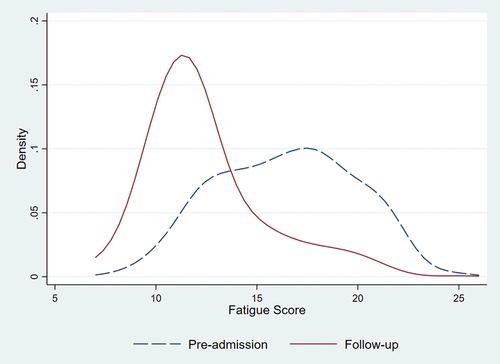
Table 5. Multiple linear regression model predicting the reduction in fatigue scores (pre-admission score – follow-up score).