
Figures & data
Table 1. Demographic data and clinical factors.
Figure 1. The mean average score and standard deviation for the total childbirth experience score, and the scoring on the childbirth experience subscales among the total study participants (n = 619).
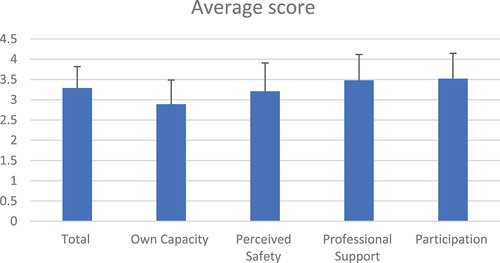
Table 2. Regression coefficients (β) and p-values for the univariate regression analysis between each determinant, the total childbirth experience score, and the scoring on the childbirth experience subscales.
Table 3. Regression coefficients (β) and p-values for the multivariate regression analysis between each significant determinant in the univariate analysis, the total childbirth experience score, and the scoring on the childbirth experience subscales.
Data availability statement
Data is not available due to ethical reasons.