Figures & data
Figure 1. (a) Schematic representation of the LCA, showing the footprint of the antenna, the orientation of the feeding pin and the lucite and brass sides of the horn aperture. (b) Configuration of the model: Lucite cone applicator, waterbolus and planar muscle-equivalent phantom.
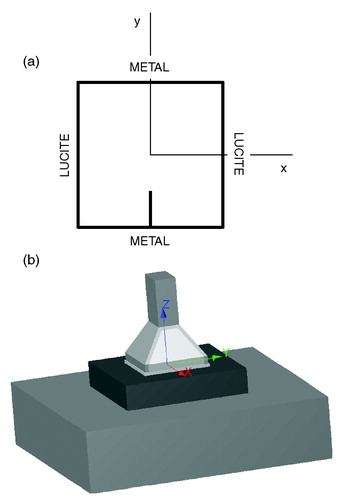
Table I. Dielectric parameters used in the FDTD simulations.
Figure 2. Effective field size as a function of square waterbolus area and waterbolus height. Results from measurements (black markers) and FDTD model (white markers). The dotted line indicates the calculated EFS in the case where no waterbolus is used.
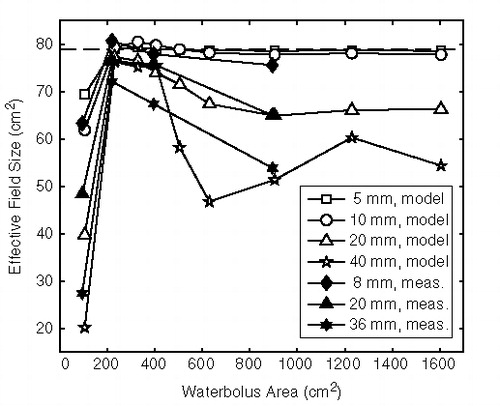
Figure 3. Effective field size as a function of waterbolus aspect ratio, for a bolus area of (a) 250 cm2 and (b) 500 cm2. Waterbolus height varies from 5 to 40 mm. The grey rectangles depict the extent of the waterboli relative to the LCA footprint (black icon).
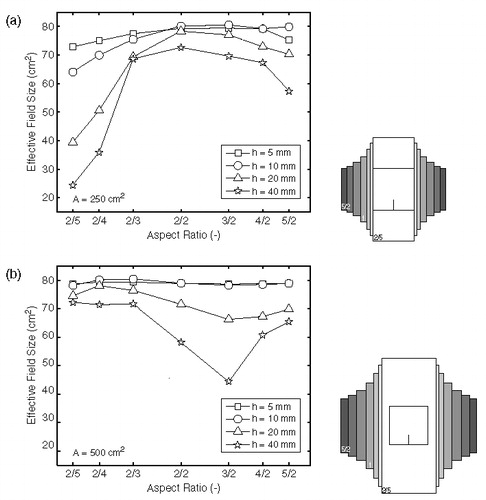
Figure 4. Effective field size as a function of distance to the waterbolus edge: effect of waterbolus shift in (a) x-direction (perpendicular to the E-field; bolus shifts towards Lucite window) and (b) y-direction (parallel to the E-field; bolus shifts towards the brass wall of the horn).
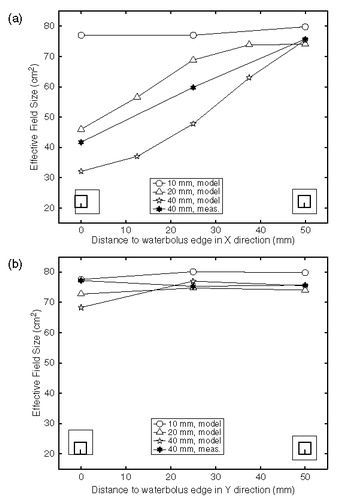
Figure 5. Calculated normalized SAR distributions at 1 cm depth in muscle-equivalent phantom illustrating the effect of waterbolus shifts of 0, 25 and 50 mm in two directions. Waterbolus dimensions: 20 × 20 × 4 cm3. The waterbolus area is depicted in grey; the square indicates the LCA footprint; the contours indicate the 25% (outer solid line), 50% (bold line), 75% (inner solid line) and 95% (dotted line) SAR/SARmax contours.
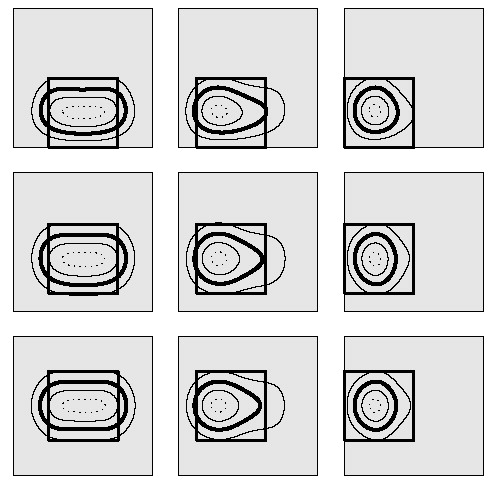
Table II. Measured and predicted effective field size values (cm2) for several waterbolus heights and areas.
Figure 6. Measured (thin lines) and predicted (bold lines) 50% SAR/SARmax contours for waterbolus shifts of 0, 25 and 50 mm in both x- and y-direction. The grey lines indicate the LCA centre and footprint. Waterbolus dimensions: 20 × 20 × 4 cm3.
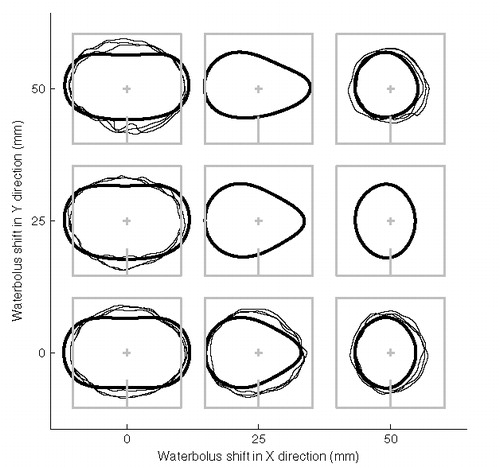
Table III. Measured and predicted EFS values (cm2) for waterbolus shifts in x- and y-direction. Waterbolus dimensions: 20 × 20 × 4 cm3. Measurement values: mean ± SD (cm2).
Figure 7. Illustration of SAR focusing when a small waterbolus is applied. Figures on the left (a, c, e) relate to a 10 × 10 × 4 cm3 waterbolus, on the right (b, d, f) to a 20 × 20 × 4 cm3 waterbolus. (a–d) depict Poynting vectors in the principal antenna planes: (a, b) YZ half-plane, parallel to, and (c, d) XZ half-plane, perpendicular to the E-field. L = lucite sidewall; B = brass sidewall. (e, f) the corresponding normalized SAR distributions at 1 cm depth: LCA footprint (grey) and 25% (thin), 50% (bold), 75% (thin) and 95% (dotted) contours.
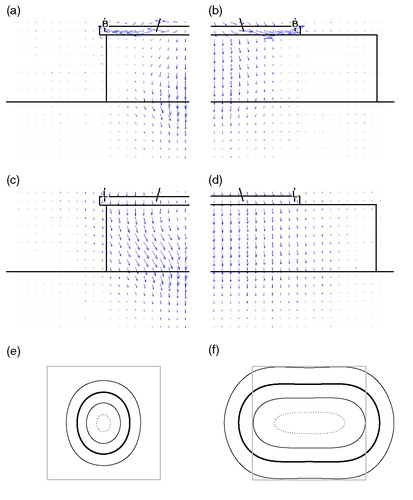
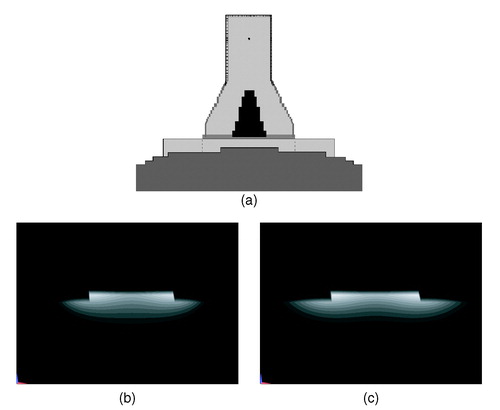
Figure 8. Example of the effect of the waterbolus on the SAR distribution in a non-flat shape. (a) Configuration: a small (10 × 10 cm2, dotted) and a larger (20 × 20 cm2) waterbolus are applied on a sphere (staircased). (b, c) Normalized SAR on a linear scale in the y = 0 cross-section (perpendicular to the E-field). The smaller waterbolus (b) restricts the SAR distribution as compared to the larger bolus (c).