Figures & data
Figure 1. The effect of exposure to 43°C (a, b) and 45°C (c, d) for various lengths of time on the clonogenic survival of wild-type HA-1 cells and the heat-resistant variants HR-1 (a, c) and OC-14 (b, d). Heating and clonogenic survival assays were performed as described in Materials and methods. The figure represents the average of three independent experiments; the error bars represent ±1 SEM.
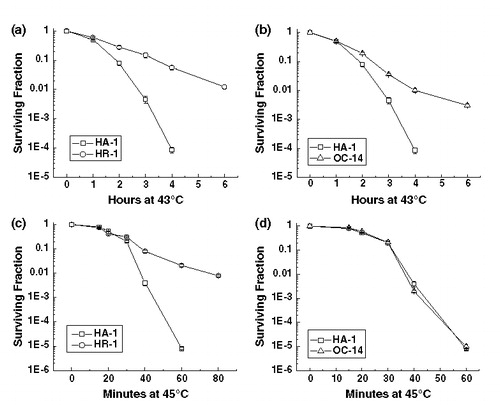
Figure 2. Heat induced radiosensitization at 43°C. Control (open symbols) and heated (43°C, 1 h) (closed symbols) HA-1 (circles), HR-1 (squares) and OC-14 (triangles) cells were exposed to increasing doses of ionizing radiation and clonogenic survival determined. Heating, irradiation and clonogenic survival assays were performed as described in Materials and methods. The figure represents the average of three independent experiments; the error bars represent ±1 SEM.
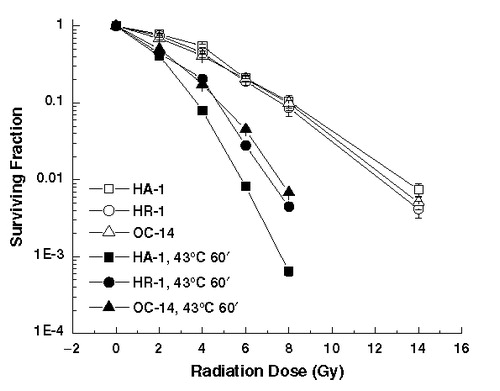
Figure 3. Heat induced radiosensitization at 45°C. Control (open symbols) and heated (45°C, 15 min) (solid symbols), HA-1 (squares), HR-1 (circles) and OC-14 (triangles) cells were exposed to increasing doses of ionizing radiation and clonogenic survival was determined. Heating, irradiation and clonogenic survival assays were performed as described in Materials and methods. The figure represents the average of four independent experiments ±1 SEM.
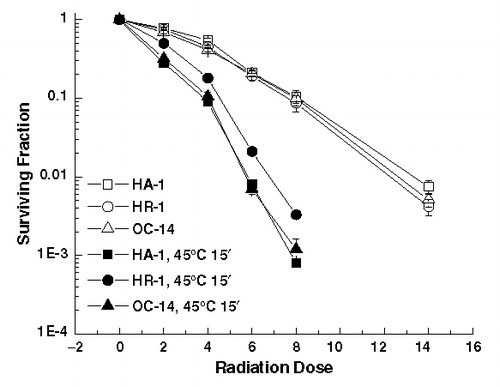
Table I. Alterations in heat induced radiosensitization in HA-1, HR-1 and OC-14 cells.
Figure 4. Recovery from heat-induced radiosensitization. (a) Control (open symbols) and heated (43°C, 1 h) (solid symbols) HA-1 (squares), HR-1 (circles) and OC-14 (triangles) cells were exposed 6, 8 to 8 Gy of ionizing radiation respectively immediately after heating or allowed to recover at 37°C for up to 12 h before irradiation and then plated for clonogenic survival. Heating, irradiation and clonogenic survival experiments were performed as described in Materials and methods. A representative experiment of two independent repeats is illustrated in (b) Control (open symbols) and heated (43°C for 1 h) (solid symbols) HA-1 (squares), HR-1 (circles) and OC-14 (triangles) cells were exposed to Gy of ionizing radiation after various times of recovery from heating and then treated as described above. A representative experiment of two independent repeats is illustrated in the figure.
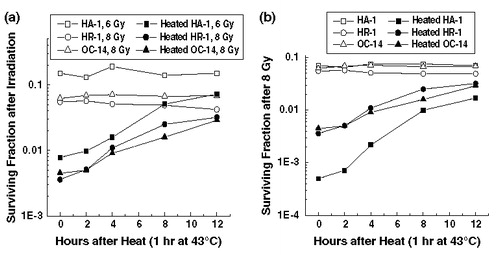
Figure 5. The effect of heat on ionizing radiation induced alterations in nucleoid halo diameters in cells exposed to 43°C for 1 h. Nucleoids were prepared from control (○), irradiated control (□), heated (Δ) and irradiated heated (⋄) HA-1 cells (a), HR-1 cells (b) and OC-14 cells (c) and were then exposed to various concentrations of propidium iodide to perform the FHA assay as described in materials and methods. In HA-1 cells, the DNA in the nucleoids from control and heated cells rewinds the most, radiation alone the least, with the radiation and heat combination intermediate (the masking effect). In both HR-1 and OC-14 cells, the inhibition of rewinding in irradiated control and heated cells is similar to that of radiation alone (lack of the masking effect). The figure represents the average of three independent experiments ±1 SEM.
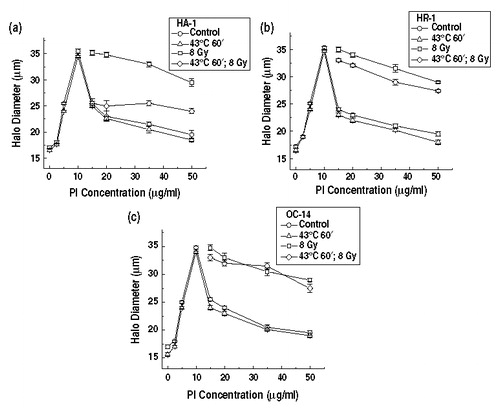
Figure 6. The effect of heat on ionizing radiation induced alterations in nucleoid halo diameters in cells exposed to 45°C for 15 min. Nucleoids were prepared from control (○), irradiated control (□), heated (Δ) and irradiated heated (⋄) HA-1 cells (a), HR-1 cells (b) and OC-14 cells (c) and were then exposed to various concentrations of propidium iodide to perform the FHA assay as described in materials and methods. In HA-1 cells, the DNA in the nucleoids from control and heated cells rewinds the most, radiation alone the least, with the radiation and heat combination intermediate (the masking effect). In HR-1 cell only the inhibition of reminding in irradiated heated cells is attenuated (reduced masking effect). The figure represents the average of three independent experiments ±1 SEM.
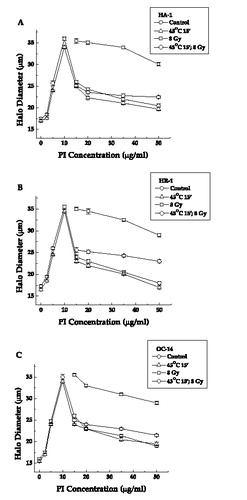
Figure 7. The effect of heating at 43°C (a) and at 45° (b) prior to irradiation on the inhibition of DNA super-coil rewinding in nucleoids from HA-1, HR-1 and OC-14 cells. The excess halo diameter (EHD) after 8 Gy of irradiation of non-heated and heated cells from each cell line was computed by adding the halo diameters measured at 15, 20, 35 and 50 µg of PI from control cells and subtracting this value from the equivalent sum from the irradiated cells. The data represents the average of three independent experiments ±1 SEM.
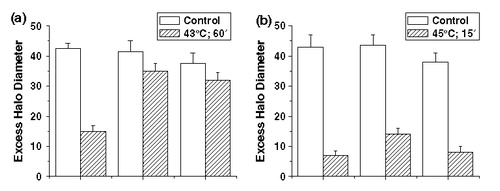
Table II. Summary of the quantitation of heat on the FHA in three cell lines.
Figure 8. The effect of exposure to 43°C on nuclear protein content. Nuclei were prepared from HA-1 (□) and OC-14 (Δ) cells exposed to 43°C for 0, 45 and 90 min and the relative nuclear protein content was determined as described in materials and methods. A representative experiment of two independent repeats is illustrated in the figure.
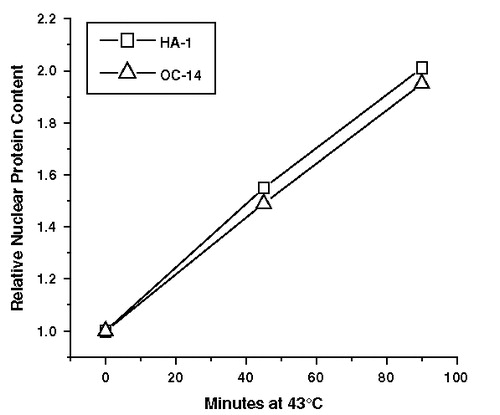
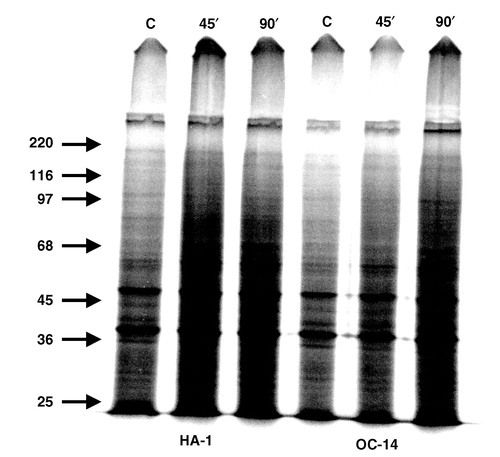
Figure 9. The effect of exposure to 43°C on the profile of nucleoid proteins. Nucleoids were prepared from control and heated HA-1 and OC-14 cells that were pre-labelled with 35S-methionine and analysed by 1-dimensional PAGE in the presence of SDS, as described in Materials and methods. Equal number of particles was loaded in each lane. The slight difference in the intensity of the samples from HA-1 and OC-14 cells is due to the fact that OC-14 cells are somewhat smaller and contain less protein per cell than HA-1 cells. The figure represents an autoradiograph obtained after 24 h exposure. The arrows mark the migration of the corresponding molecular weight markers.