Figures & data
Figure 1. Feedback control of the thermal dose: KD = dose controller; KT = temperature controller; P = patient; S(·) = T90 selector and H = dose estimator.
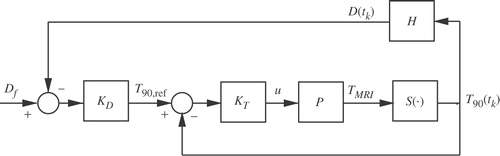
Figure 2. (a) MaRCUPS showing the Mylar-covered treatment window, transducer positioning components and 45° reflecting ultrasound mirror. (b) Thermal treatment control system during in-vivo experiments inside MRI.
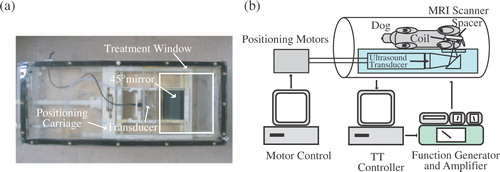
Figure 3. Thermal dose control in phantom. (a) Control input. (b) Increase in T90, T90,ref, Tcons and Ttum,max, (c) Tumour thermal dose.
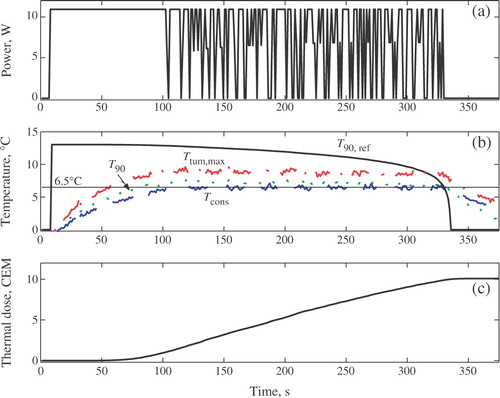
Figure 4. Thermal dose control in in-vivo canine. (a) Control input. (b) Increase in T90, T90,ref, Tcons and Ttum,max. (c) Tumour thermal dose.
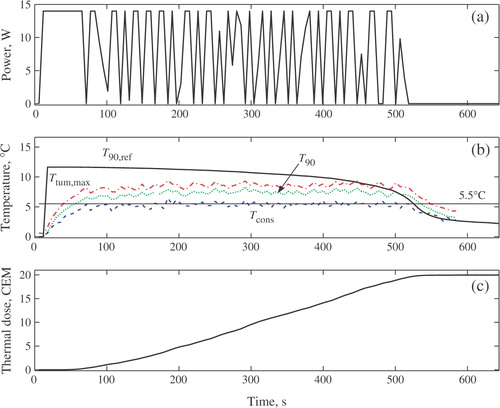
Figure 5. Spatial distribution of the delivered thermal dose in the treatment domain at various times. The target spans from 9.0–10.9 cm. The normal tissue constraint was placed at 8.3 cm.
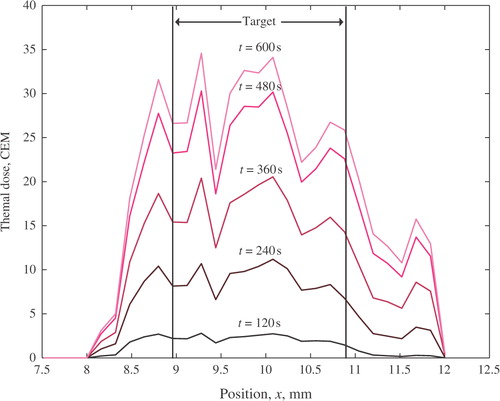
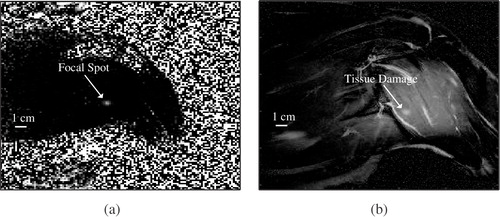
Figure 6. (a) Coronal phase subtraction image showing the pre-treatment location of a focal zone in dog's thigh. (b) T2 weighted turbo spin echo coronal image taken near the center of the dog's thigh.