1,511
Views
4
CrossRef citations to date
0
Altmetric
Original

Effects of diuretic-induced hypovolemia/isosmotic dehydration on cardiorespiratory responses to hyperthermia and its physical treatment in rabbits

, MD, PhD, , , &
Pages 135-147 | Received 12 Jul 2005, Accepted 14 Dec 2005, Published online: 26 Aug 2009

Figures & data

Table I.  Respiratory and cardiovascular variables before and after induction of hypovolemia by administration of furosemide.

Figure 1. Changes in minute ventilation (VE) during hyperthermia and its physical treatment in the normovolemic (solid line) and hypovolemic (dashed line) groups. Each point represents mean ± SEM. *p < 0.05 significantly different from the normovolemic group at the same body temperature. 38a: initial level of animal body temperature after induction of hypovolemia/isosmotic dehydration.
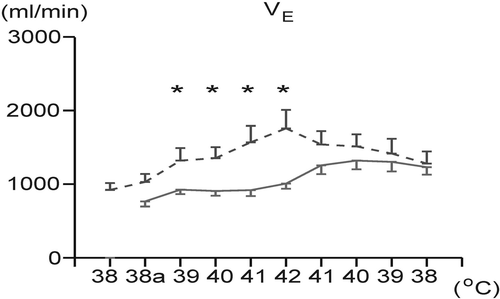
Figure 1. Changes in minute ventilation (VE) during hyperthermia and its physical treatment in the normovolemic (solid line) and hypovolemic (dashed line) groups. Each point represents mean ± SEM. *p < 0.05 significantly different from the normovolemic group at the same body temperature. 38a: initial level of animal body temperature after induction of hypovolemia/isosmotic dehydration.
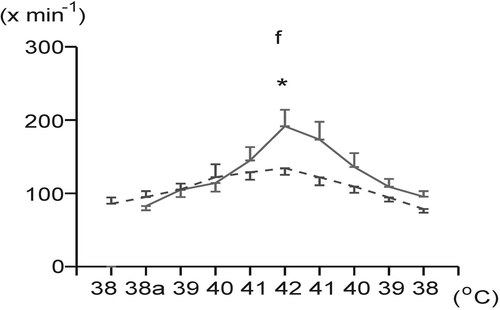
Table II.  Respiratory and cardiovascular effects of hyperthermia and its physical treatment in normovolemic (NV) and hypovolemic (HV) groups.

Figure 2. Changes in frequency of breathing (f) during body surface heating and cooling in the normovolemic (solid line) and hypovolemic (dashed line) groups. Each point represents mean ± SEM. *p < 0.05 significantly different from the normovolemic group at the same body temperature. 38a: initial level of animal body temperature after induction of hypovolemia/isosmotic dehydration.
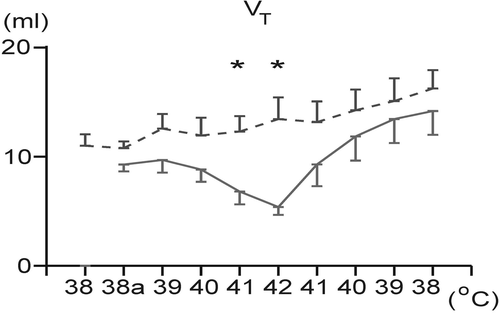
Figure 2. Changes in frequency of breathing (f) during body surface heating and cooling in the normovolemic (solid line) and hypovolemic (dashed line) groups. Each point represents mean ± SEM. *p < 0.05 significantly different from the normovolemic group at the same body temperature. 38a: initial level of animal body temperature after induction of hypovolemia/isosmotic dehydration.

Figure 3. Changes in tidal volume (VT) during overheating to 42°C and during body temperature recovery in the normovolemic (solid line) and hypovolemic (dashed line) groups. Each point represents mean ± SEM. *p < 0.05 significantly different from the normovolemic group at the same body temperature. 38a: initial level of animal body temperature after induction of hypovolemia/isosmotic dehydration.

Figure 3. Changes in tidal volume (VT) during overheating to 42°C and during body temperature recovery in the normovolemic (solid line) and hypovolemic (dashed line) groups. Each point represents mean ± SEM. *p < 0.05 significantly different from the normovolemic group at the same body temperature. 38a: initial level of animal body temperature after induction of hypovolemia/isosmotic dehydration.

Figure 4. Changes in ear skin blood flow (SBF), as laser Doppler flowmetry during hyperthermia and its physical treatment in the normovolemic (NV) and hypovolemic (HV) groups. Each point represents mean ± SEM.
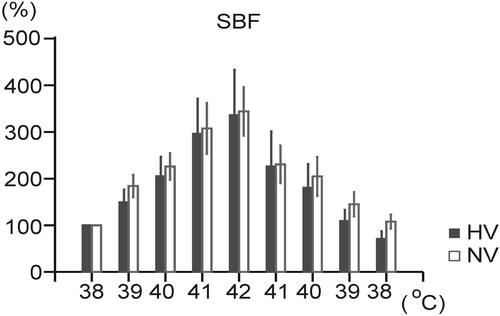
Figure 4. Changes in ear skin blood flow (SBF), as laser Doppler flowmetry during hyperthermia and its physical treatment in the normovolemic (NV) and hypovolemic (HV) groups. Each point represents mean ± SEM.
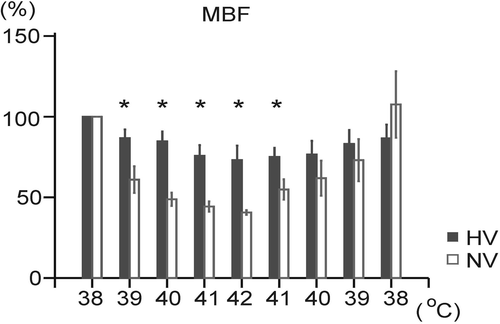
Figure 5. Changes in mesenteric blood flow (MBF) during body surface heating and cooling in the normovolemic (NV) and hypovolemic (HV) groups. Each point represents mean ± SEM. *p < 0.05 significantly different from the normovolemic group at the same body temperature.

Figure 5. Changes in mesenteric blood flow (MBF) during body surface heating and cooling in the normovolemic (NV) and hypovolemic (HV) groups. Each point represents mean ± SEM. *p < 0.05 significantly different from the normovolemic group at the same body temperature.

Figure 6. Changes in renal blood flow (RBF) during hyperthermia and its physical treatment in the normovolemic (NV) and hypovolemic (HV) groups. Each point represents mean ± SEM.
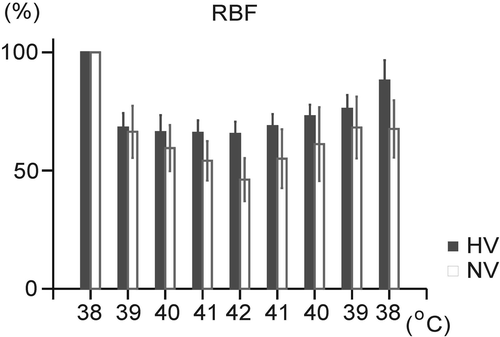
Figure 6. Changes in renal blood flow (RBF) during hyperthermia and its physical treatment in the normovolemic (NV) and hypovolemic (HV) groups. Each point represents mean ± SEM.

Reprints and Corporate Permissions

Please note: Selecting permissions does not provide access to the full text of the article, please see our help page How do I view content?

To request a reprint or corporate permissions for this article, please click on the relevant link below:

Academic Permissions

Please note: Selecting permissions does not provide access to the full text of the article, please see our help page How do I view content?

Obtain permissions instantly via Rightslink by clicking on the button below:

If you are unable to obtain permissions via Rightslink, please complete and submit this Permissions form. For more information, please visit our Permissions help page.