Figures & data
Figure 1. Two typical thermal maps provided by RHyThM: (a) A thermal map, as accepted for the study, with no shift in transition between in- and out side the body during whole of the treatment session. (b) A thermal map with shift in transition between in- and outside the body, not accepted. The graph shows that the start position of the steep temperature decay moves over time towards the left.
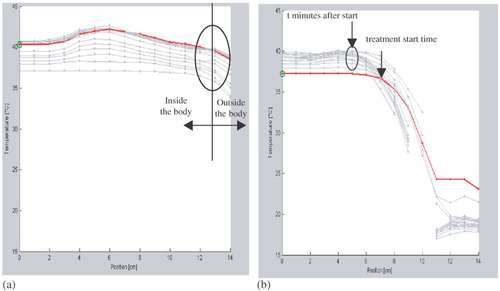
Figure 2. Intra-luminal temperature measurement. TC (tumour contact) is defined as close contact of the thermometry catheter with tumour; TI (tumour indicative) is defined as the position of the thermometry catheter ventral or dorsal of the tumour in the same transverse plane as the tumour but not in contact. Figure copied from Wielheesen et al. Citation[4], with permission of the author.
![Figure 2. Intra-luminal temperature measurement. TC (tumour contact) is defined as close contact of the thermometry catheter with tumour; TI (tumour indicative) is defined as the position of the thermometry catheter ventral or dorsal of the tumour in the same transverse plane as the tumour but not in contact. Figure copied from Wielheesen et al. Citation[4], with permission of the author.](/cms/asset/9a725176-4ddb-40d4-aae8-b709db7bbdd6/ihyt_a_177272_f0002_b.jpg)
Figure 3. Average vagina T50 value, for all treatments, vs. thermal probe catheter position. Position 0 cm represents the deepest point in the lumen.
Table I. Average temperature values for Tmean, T20, T50, T90 and Tmax (maximum of Tmax) as obtained in the study. Numbers in parentheses (in°C) show 1 SD.
Table II. Average temperature values for Tmean, T20, T50, T90 and Tmax (maximum of Tmax) in different lumens. Numbers in parentheses (in°C) show 1 SD.
Figure 4. (a) Vagina normal tissue T50 vs. vagina tumour contact T50, (b) Bladder normal tissue T50 vs. bladder tumour indicative T50.
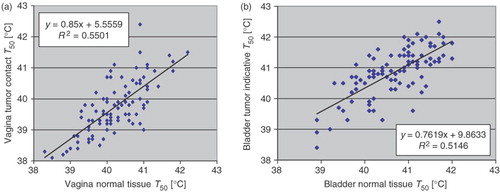
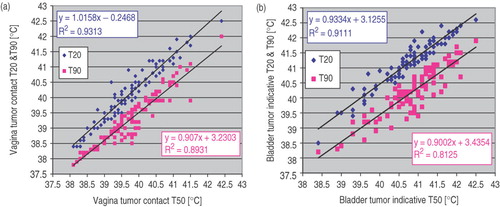
Figure 5. (a) Vagina tumour contact T50 vs. vagina tumour contact T20 and T90, (b) Bladder tumour indicative T50 vs. bladder tumour indicative T20 and T90.