Figures & data
Figure 1. Images of SA-812 hyperthermia applicator: (a) Front view, (b) Side view.
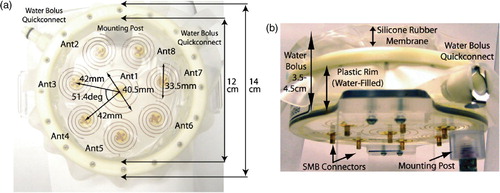
Figure 2. Images of the SA-812 antenna mounted in SAR measurement ‘scantank’: (a) Front view of x--y scan plane, (b) Side view showing E-field probe in liquid muscle tissue phantom and air backed applicator.
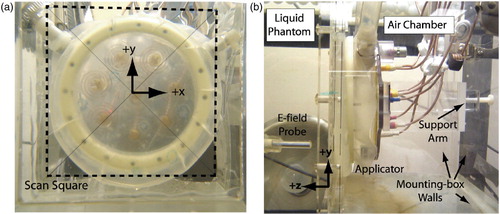
Figure 3. Return-loss of several antenna elements.
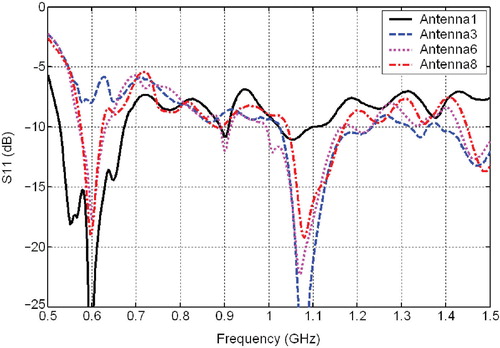
Table I. Individual antenna measurements at 915 MHz.
Figure 4. SAR scans in a plane 3 mm deep in muscle equivalent phantom under individual spiral antennae: (a) Antenna 1, (b) Antenna 3, (c) Antenna 6, (d) Antenna 8. SAR contours are superimposed over a 1:1 scale photograph of the applicator face aligned precisely with the antenna array scan data (±1 mm, ±1°). Four contour lines are shown in bold: 95% (purple), 75% (yellow), 50% (red) and the outer 25% contour (green). Other contour lines spaced evenly from 10% to 90% in 10% increments.
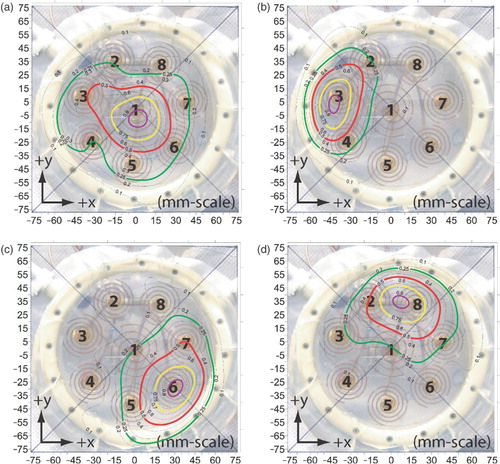
Table II. Input power levels for three treatment configurations.
Figure 5. SAR pattern of spiral array driven with non-coherent 915 MHz sources and adjusted for optimum uniformity at z = 3 mm deep in muscle phantom: (a) Contours: treatment plan (dashed); measurement (solid), (b) Wireframe (measured). Four contour lines are shown in bold: 95% (purple), 75% (yellow), 50% (red) and the outer 25% contour (green). Other contour lines spaced evenly from 10% to 90% in 10% increments.
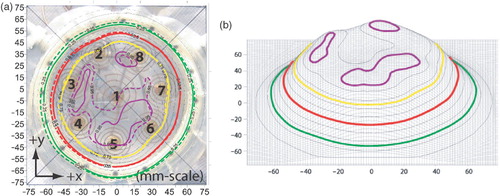
Figure 6. SAR pattern of spiral array driven with non-coherent 915 MHz sources and adjusted for optimum uniformity: (a) Contours, treatment plan (dashed) at z = 3 mm, measurement (solid) at z = 10 mm, (b) Wireframe (measured); (c) Cut through y--z plane (x = 0.25 mm); (d) Cut through x--z plane (y = 0.25 mm). All measured data normalized to peak SAR at 10 mm depth. Four contour lines are shown in bold: 95% (purple), 75% (yellow), 50% (red) and the outer 25% contour (green). Other contour lines spaced evenly from 10% to 90% in 10% increments.
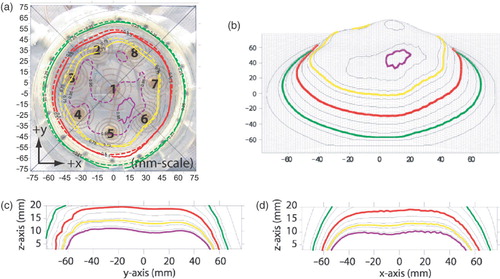
Figure 7. SAR pattern of the spiral array applicator when adjusted according to the ‘C’ shape pre-plan of . Measured results (solid) are at z = 5 mm depth, treatment plan results (dashed) are at z = 3 mm depth. Four contour lines are shown in bold: 95% (purple), 75% (yellow), 50% (red) and the outer 25% contour (green). Other contour lines spaced evenly from 10% to 90% in 10% increments.
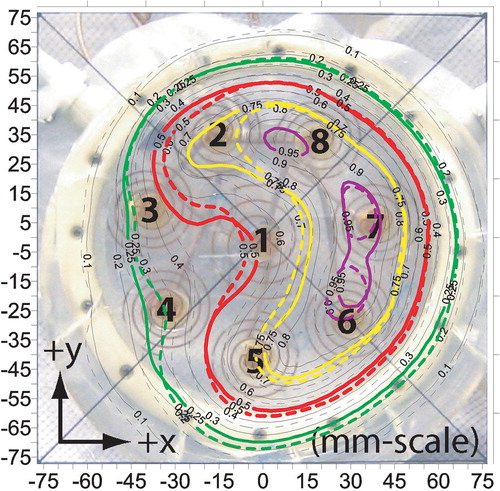
Figure 8. SAR pattern of the spiral array applicator z = 5 mm deep in muscle phantom, when adjusted according to the ‘Donut’ shape pre-plan of . Five contour lines are shown in bold: 95% (purple), 75% (yellow), 61% (blue), 50% (red) and the outer 25% contour (green). 61% contour line shows the minimum central depression of the pattern.
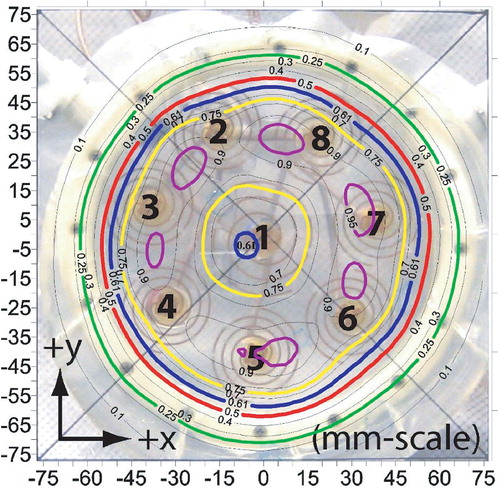
Figure 9. 1D comparison of spiral array applicator SAR patterns across the x-axis at z = 5 mm and y = 0.25 mm.